Paid Social Audit: How to Diagnose a ROAS Under 1.0
A paid social audit should start before anyone cuts budget. When ROAS drops below 1.0, the problem may be weak media performance, but it may also be missing revenue, bad event setup, or friction after the click. This guide shows how to sort a low ROAS in the right order so teams can find the first point of failure, stop waste, and decide what to fix next.
TL;DR
A paid social audit should begin with tracking because pixel-only reporting can miss sales and distort ROAS.
Media setup should be checked next to find overlap, weak budget splits, and unstable delivery.
Ad fatigue and message-offer mismatch often show up through falling CTR, high frequency, and weak hold rates.
Post-click issues like slow mobile pages, long forms, and surprise shipping costs can sink ROAS even when ads win clicks.
Channel decisions should follow backend revenue checks, not platform dashboards alone.
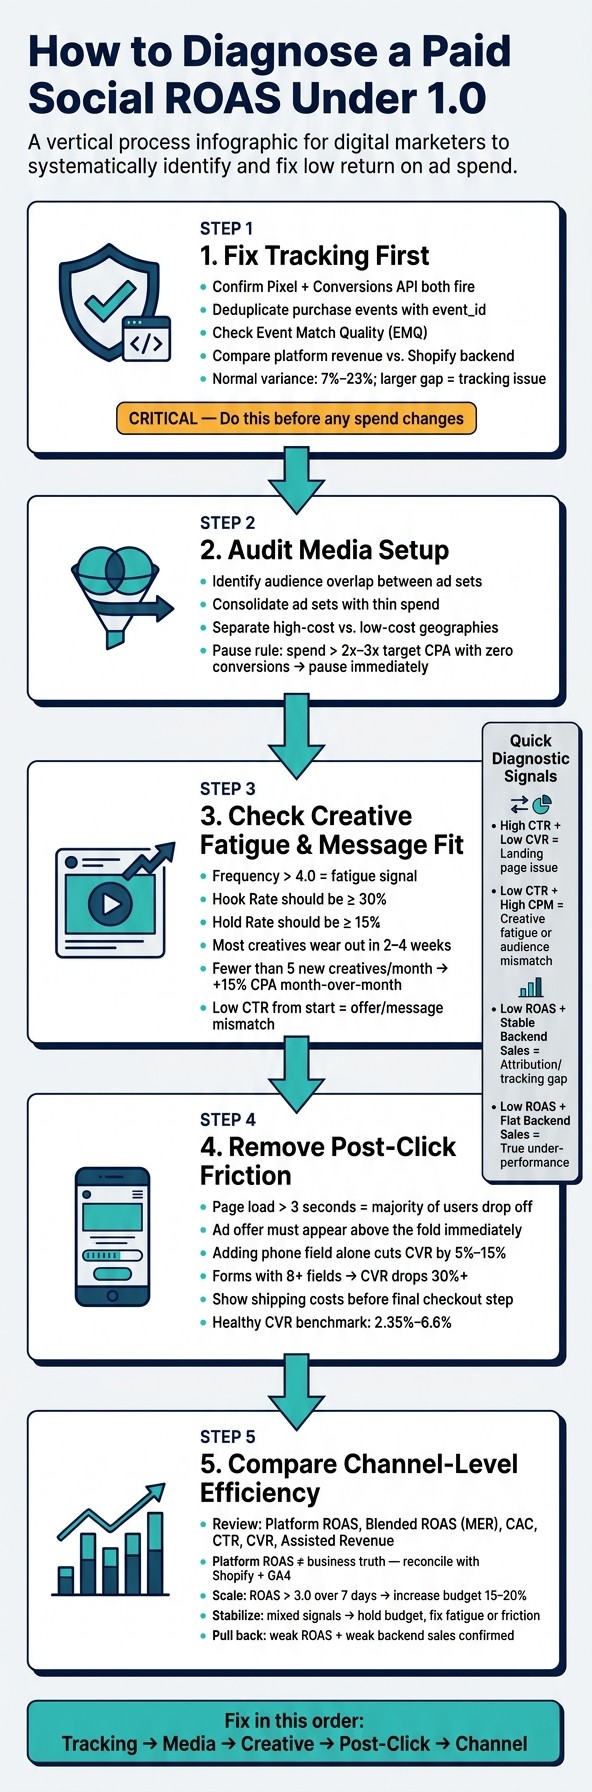
Paid Social ROAS Under 1.0: 5-Step Audit Framework
Why a paid social audit should start with tracking
A ROAS below 1.0 means less than $1.00 in tracked revenue came back for every $1.00 spent. That sounds simple, but the number can be wrong.
Meta and TikTok do not see every sale. If browser tracking is blocked, if Conversions API is weak, or if purchase events are duplicated or missing, platform ROAS can drift far from actual store revenue. That is why the first step is not to swap ads or cut spend. The first step is to verify that the account is measuring purchases the right way.
The main checks are direct:
Pixel and Conversions API should both fire.
Purchase events should dedupe with
event_id.Purchase should sit at the top of aggregated event ranking where needed.
Match quality should be strong enough to tie user data back to buyers.
Backend data matters most here. Shopify is often the best sales source because it uses first-party order data. GA4 can help, but it can miss sessions and conversions when consent settings or browser limits get in the way.
If platform revenue and backend revenue are far apart, the ROAS problem may be measurement before it is media.
How to confirm whether low ROAS is real
A low ROAS should be tested against other systems before any account change is made. The cleanest way is to compare the same date range, time zone, and attribution view across Meta or TikTok, GA4, Shopify, and email platform revenue where needed.
A small gap is normal. A large gap is a warning sign.
When the platform claims much more revenue than Shopify, it may be taking too much credit. When the platform shows much less revenue than Shopify, purchase tracking may be incomplete. In both cases, budget decisions become shaky.
The main goal is simple: find out whether the revenue shortfall is real or just undercounted.
Teams should also scan for signs that numbers do not make sense:
Very low CPC with no lift in store sales
High conversion volume with flat backend orders
Purchase event spikes after setup changes
Different totals across tools using the same window
According to Google’s GA4 documentation, attribution models and reporting scopes can differ across tools, which is one reason side-by-side checks matter. For paid media teams, that means no single dashboard should act as the final scorecard.
For more on measurement issues across channels, Bigeye’s paid media services and analytics consulting pages cover how audit work ties back to business data.
Media setup often causes low ROAS before ad changes do
Once tracking is clean, the next step is media setup. Many paid social accounts lose money because the structure blocks stable delivery.
Three issues show up again and again:
audience overlap
too many ad sets with thin spend
budgets pushed into weak geographies or low-intent groups
When ad sets compete against each other, CPM can climb while results fall. When spend is split across too many segments, none of them may collect enough conversion data for the platform to learn. When high-cost and low-cost markets sit in one ad set, budget can drift to cheap impressions that look good on the surface but pull down sales quality.
A cleaner account often means:
fewer ad sets
clearer exclusions
separate geographies when market behavior is very different
more spend behind groups that can actually exit the learning phase
A simple pause rule helps stop waste fast. If an ad set spends more than 2x to 3x target CPA with no conversions, it usually should not stay live.
That does not mean every low-volume ad set is bad. It does mean low-volume structures can hide the problem by never giving the system enough data to optimize.
Low ROAS often points to ad fatigue or message mismatch
If tracking is clean and media setup looks sound, the next question is whether the ads are worn out or simply missing the mark.
Ad fatigue tends to show up in a familiar pattern:
frequency climbs above 4.0
CTR slips
CPC moves up
performance drops on older assets
Message mismatch looks different. In that case, the ad gets attention, but the value prop does not line up with audience intent or the landing page promise. A user clicks, but the sale does not follow.
For video-led paid social, the first few seconds matter. Weak hook rates and hold rates often point to a top-of-funnel problem before checkout data even enters the picture. On TikTok in particular, fatigue can happen fast, and ad rotation may need to happen every few days rather than every few weeks.
The fix depends on the signal:
If frequency is high and CTR is falling, rotate the ads.
If CTR is low from the start, review the offer and opening message.
If CTR is healthy but purchases lag, look after the click instead of blaming the ad.
This is where many teams waste money. They change targeting when the ad is tired, or they change ads when the page is losing the sale.
Bigeye’s brand strategy and paid social media planning work often intersect here because weak message fit can drag down both click-through rate and conversion rate.
Post-click friction can keep ROAS under 1.0 even when ads work
A paid social campaign can win the click and still lose the sale.
That usually happens on mobile. If the landing page loads in more than 3 seconds, many visitors drop off before they even see the offer. If the ad promises 40% off, that same deal should appear above the fold right away. If it does not, bounce rate climbs.
The most common leaks are simple:
slow page speed
poor mobile layout
long forms
unclear shipping costs
weak message match between ad and page
checkout steps that ask for too much
Even one extra field can hurt form completion. Long checkout flows can cut conversion rate hard, especially for cold paid social traffic.
A clean post-click review should check:
page load speed on mobile
headline match with the ad
image and offer match
cart drop-off
checkout completion rate
payment options
shipping clarity before final step
According to Google PageSpeed guidance, mobile performance has a direct link to bounce and conversion behavior. In paid social, that means site fixes can matter just as much as media changes.
Channel comparison should come last, not first
Once tracking, media, ads, and post-click flow have been checked, channel-level comparison becomes much more useful.
This is where teams look past platform ROAS and compare:
backend revenue
customer acquisition cost
click-through rate
conversion rate
assisted revenue
blended ROAS or MER
A channel can look weak in-platform and still support total sales. A channel can also look strong in-platform while backend revenue stays flat. That is why platform dashboards should act as signals, not final truth.
The main question is not “Which platform says it won?”
The main question is “Which channel moved store revenue at a cost the business can support?”
For example:
High CTR and low CVR often point to page or offer issues.
High CPM and low CTR often point to ad fatigue or audience problems.
Low ROAS with flat backend sales points to true underperformance.
Low ROAS with stable backend sales points to tracking or attribution gaps.
This order matters because it keeps teams from pulling budget out of a channel that is helping more than last-click reports show.
What should be fixed first when ROAS drops below 1.0
The best fix order is based on confidence and speed to impact.
Start here:
Fix tracking issues first.
Pause spend that is clearly being wasted.
Replace worn-out ads or weak offer angles.
Repair landing page and checkout friction.
Test new audiences only after the first four checks are done.
That sequence keeps teams from making broad
TL;DR
Audit ROAS under 1.0 in this order: tracking, media, creative, post-click, then channel efficiency.
Pixel-only tracking can miss many conversions, so low ROAS may reflect undercounted revenue rather than poor ad output.
Each step depends on the one before it, which means early mistakes can distort every later decision.
The framework works best when teams isolate the first break point before shifting budget or changing ads.
Audit Step | Primary Focus | Key Tools |
|---|---|---|
1. Tracking | Pixel/CAPI health, Event Match Quality | Meta Events Manager, Shopify, GA4 |
2. Media | Audience overlap, budget waste, targeting quality | Ads Manager, Meta Audience Overlap Tool |
3. Creative | Hook/Hold rates, fatigue, message-offer fit | Ads Manager, TikTok Creative Center |
4. Post-Click | Load speed, mobile friction, checkout leaks | Google PageSpeed Insights, Shopify Analytics |
5. Channel | Blended ROAS, CAC by channel, assisted revenue | GA4, Klaviyo |
Each step builds on the one before it. Fixing creative while tracking is broken leads to shaky readouts. Reallocating budget while the landing page leaks conversions burns spend twice. The sequence matters because it keeps teams from solving the wrong problem.
What Does a ROAS Under 1.0 Actually Mean for Paid Social Campaigns?
A ROAS under 1.0 means paid social ads bring back less than $1 in tracked revenue for every $1 spent. In plain terms, the campaign is not paying for itself on the numbers being reported. Once COGS, shipping, and overhead are added, that usually points to unprofitable spend. A simple example makes it clear: spend $1,000 and track $800 in revenue, and the result is a 0.80 ROAS.
That said, a ROAS under 1.0 is a signal, not a final judgment. The right move is not to panic or cut spend on the spot. The audit starts by finding where revenue stopped lining up with spend.
Platform ROAS vs. Blended Revenue Efficiency
Platform ROAS and blended ROAS answer different questions, and mixing them up can send a team in the wrong direction. Meta and TikTok each report performance through their own attribution windows. Those windows can differ from what the business sees in actual sales data, so platform numbers may look better or worse than the full picture.
Blended ROAS - often called Marketing Efficiency Ratio, or MER - divides total business revenue by total ad spend across all channels. That makes it the better business health check because it shows what the company is earning against total spend, not just what one platform claims credit for.
Metric | What It Measures | Why It Matters in an Audit |
|---|---|---|
Platform ROAS | Revenue attributed by Meta or TikTok | Channel-specific diagnostic signal |
Blended ROAS (MER) | Total revenue ÷ total ad spend | Business health check across all channels |
Contribution Margin | Revenue minus variable costs (COGS, shipping) | True profitability guide for spend decisions |
Both metrics matter. Platform ROAS helps spot channel-level issues. Blended ROAS shows whether the business as a whole is moving in the right direction. Contribution margin brings the profit lens into the picture. Still, no diagnosis should start with any of these numbers alone until tracking is checked first.
When a Dip Is Normal and When It Needs a Full Audit
Not every dip means a campaign is broken. Paid social has normal swings, and a short drop can happen without pointing to a deeper issue. That is common during platform learning periods, right after major budget shifts, or during seasonal demand changes.
The key is duration and timing. A ROAS under 1.0 becomes audit-worthy when it sticks around for more than 14 days after the account has stabilized. In other words, a brief wobble is one thing. Two weeks of weak returns after the dust settles is another.
Why Audit Order Matters
When a drop lasts past a normal learning period, the audit order matters more than most teams expect. Jumping straight into budget cuts or swapping creative can waste time if the numbers are wrong in the first place.
The first step is to verify tracking and attribution. If the dip is real, start with pixel health, CAPI setup, and purchase-event accuracy. Then check whether the tracking stack is undercounting revenue. Only after that should the team change spend, audiences, or ad creative. Otherwise, the account may get “fixed” based on bad measurement, which is a bit like changing the route before checking whether the map is off.
How Do You Verify That a ROAS Under 1.0 Is a Real Problem and Not a Tracking Error?
A ROAS below 1.0 only matters if the revenue gap is real. If tracking is wrong, the number can't guide spend, audience changes, or ad updates. That is why the first step is always data validation. Once revenue tracking checks out, then it makes sense to review audience overlap, budget split, and ad creative.
Check Pixel, Conversions API, and Purchase Event Health
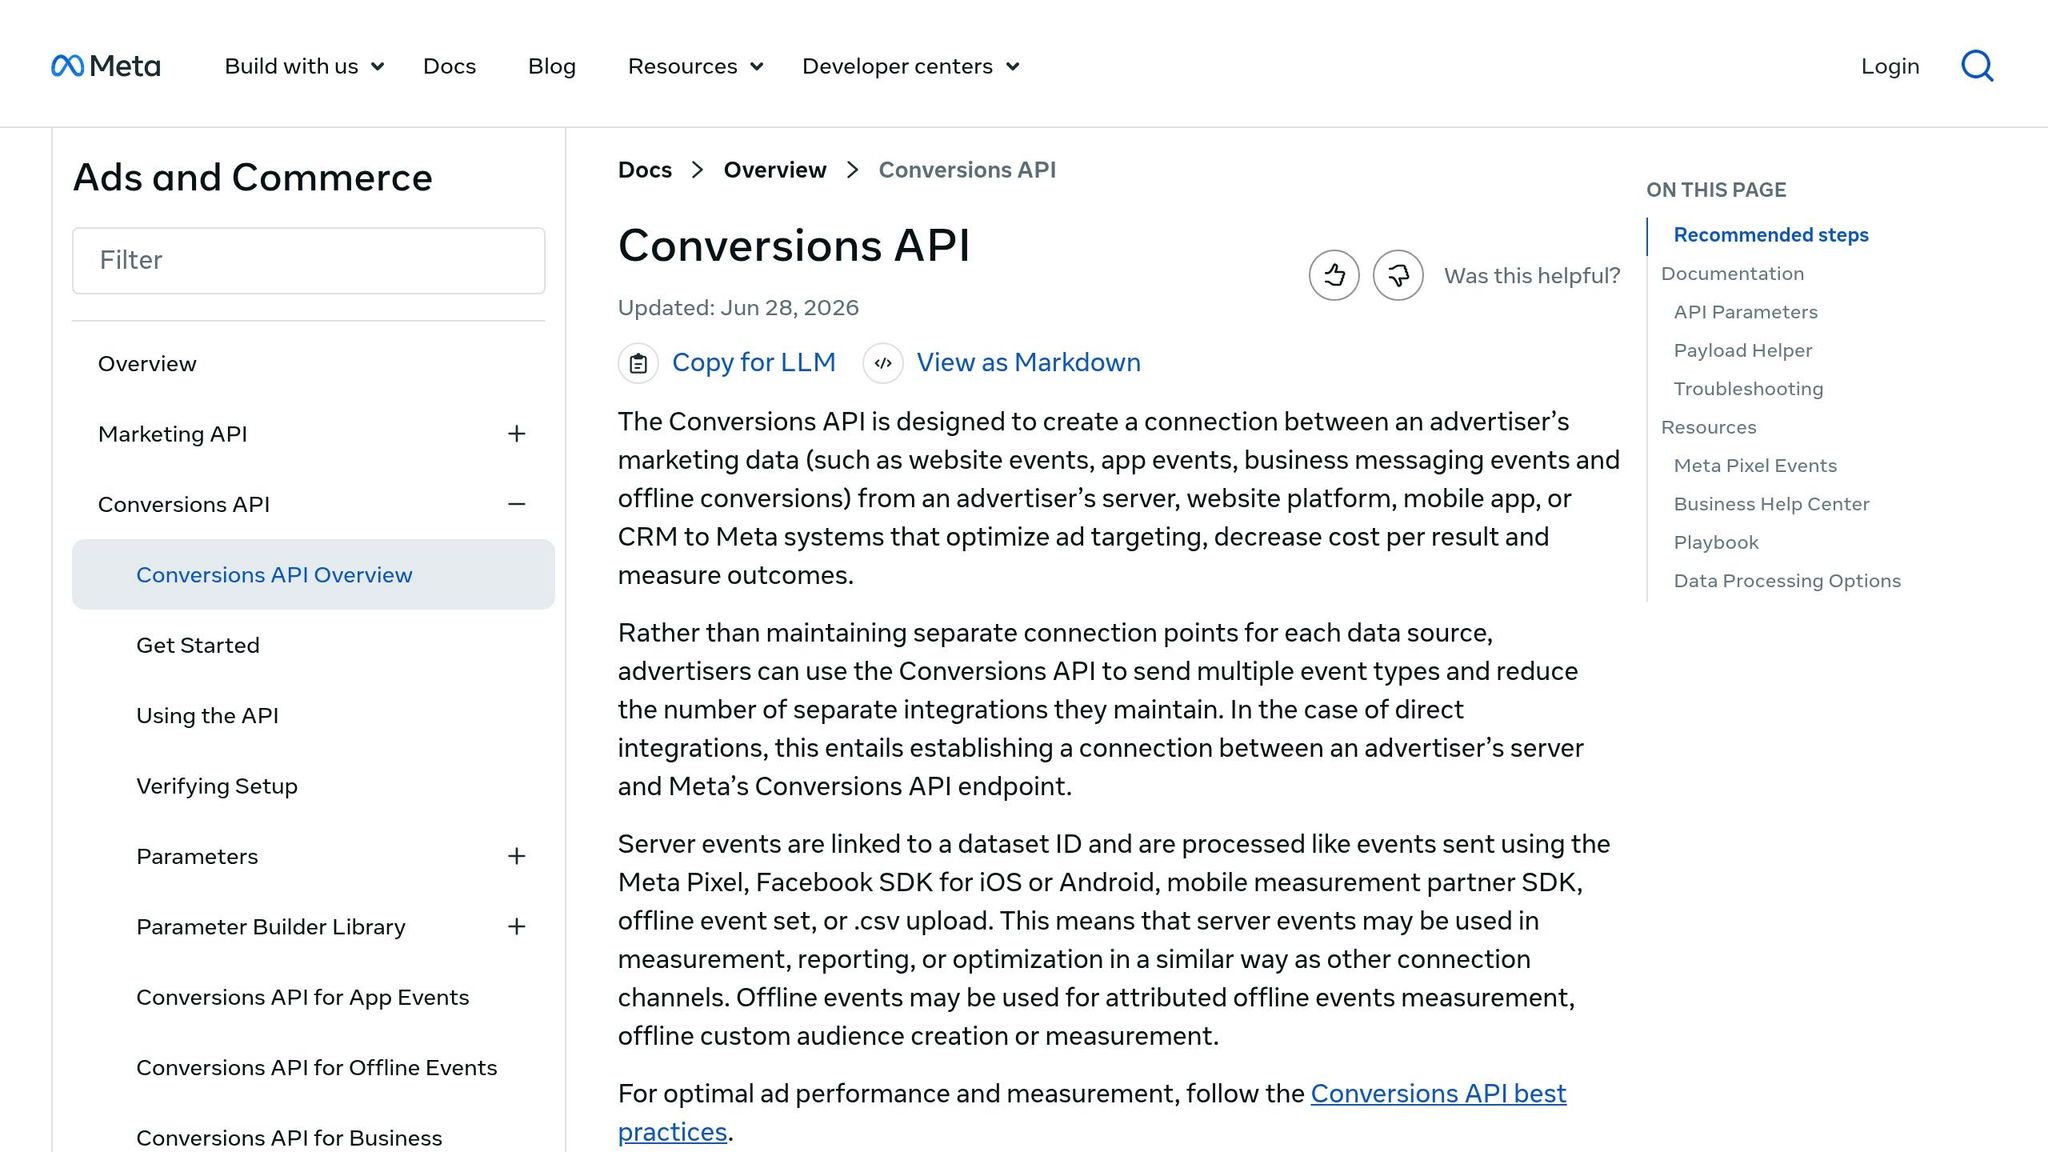
Start with the core setup. Confirm that the browser pixel and Conversions API are both firing, that events are deduped with event_id, and that EMQ is strong enough to support buyer matching. Hashing email and phone data can improve match quality and help platform optimization work as intended.
Purchase should also be set as the top AEM event so opted-out iOS purchases still come through.
If those checks pass, the next step is to look at audience overlap and budget allocation.
Reconcile Platform Data with GA4, Shopify, and Klaviyo

Compare platform revenue against Shopify, GA4, and Klaviyo using the same date range and time zone. Variance in the 7% to 23% range is normal. When the gap gets larger than that, there is usually a tracking or attribution issue that needs a closer look.
Shopify is the strongest revenue reference because it uses first-party data. GA4, by contrast, can undercount when browser cookies are blocked or user consent is limited. If conversion rates or CPC look implausible, that is usually a tracking problem, not a performance win.
Use an Attribution Comparison Table
A side-by-side table makes mismatches easier to spot.
Metric | Platform (Meta/TikTok) | GA4 (Last Click) | Shopify/Backend | Variance (%) |
|---|---|---|---|---|
Revenue | $10,000 | $7,500 | $11,000 | 10–30% |
Conversions | 100 | 70 | 105 | 5–35% |
If platform revenue is higher than Shopify, the platform may be taking too much credit. If platform revenue is lower than Shopify, purchase tracking may be incomplete. In both cases, the ROAS figure is not steady enough to guide account changes.
Flag any material gap between platform and backend revenue, fix the data issue, and then test ROAS again.
How Do You Tell If Low ROAS Is a Targeting, Structure, or Budget Problem?
Once tracking data is clean, the next audit layer is media setup: audience quality, campaign structure, and budget allocation. If ROAS is still below 1.0, the problem often sits in one of those three areas. Poor audience inputs can send ads to the wrong people. Messy account structure can choke delivery. Weak budget splits can waste spend before Meta has a fair shot to optimize.
Review Audience Quality and Overlap
Start with the audience source. Not all targeting pools perform the same way, and that gap can be expensive. Custom Audiences built from the top 20% of customers by lifetime value can produce a 47% lower CPA than interest-based targeting.
That result matters because audience quality shapes everything that follows. If the seed list is weak, even strong creative and a solid offer can struggle. By contrast, a high-value customer file gives Meta a clearer signal about who is worth finding.
Overlap is the next checkpoint. When ad sets go after similar groups, they can end up bidding against each other in the same auction. That internal competition can push CPMs up and pull ROAS down. Meta's Audience Overlap tool helps spot that cannibalization before it drains more budget.
Prospecting exclusions also need a hard check. Recent purchasers - usually the last 30 days - should be excluded from prospecting campaigns. Without that filter, spend can drift toward users who were likely to convert anyway, which muddies performance and makes scaling harder.
Image alt text: Meta audience overlap analysis for prospecting campaign segments
Check Campaign Structure and Delivery Stability
Campaign structure has a direct effect on delivery stability. Meta generally needs enough weekly conversions per ad set to stabilize . If spend is split across too many ad sets, none of them may hit that volume, and results can stay volatile week after week.
This is where many accounts get stuck. On paper, a heavily segmented setup can look neat. In practice, it often spreads budget too thin. The platform then has too little signal in each ad set, which slows learning and weakens optimization.
When that happens, consolidation is often the fastest fix. Fewer ad sets with stronger funding give Meta more room to learn and optimize against actual conversion data. Instead of ten lightly funded ad sets, a tighter build can produce cleaner signals and steadier delivery.
Naming discipline helps here too. A single format, such as Brand_Product_Geo_Channel_Objective, makes it much easier to scan spend, compare performance, and catch waste fast. Small operational habits like this save time during audits and reduce account confusion.
Image alt text: campaign structure audit for Meta ad set delivery stability
Flag Budget Waste with a Keep-Test-Pause Table
Budget allocation can waste money even when the audience and creative are sound. One common issue shows up when materially different geographies sit inside the same ad set. Those markets often behave differently on CPM, conversion rate, and average order value. Splitting them into separate ad sets helps protect budget quality and makes performance easier to judge.
A simple keep-test-pause system helps separate what needs time from what needs action now .
Ad Set Status | Threshold | Action |
|---|---|---|
Keep / Scale | ROAS > 3.0 over 7 days | Increase budget by 15–20% increments |
Test | New audience or creative variant | Allocate 20–30% of total budget |
Pause | Spend > 2–3x target CPA with no conversions | Pause immediately; reallocate spend |
Stabilize | Fewer than 50 conversions per week | Consolidate into higher-volume ad sets |
This framework keeps teams from making two expensive mistakes at once: cutting tests too early or leaving weak ad sets live for too long. A new audience or new creative variant may need controlled budget to prove itself. An ad set that has already spent more than 2–3x target CPA without a conversion usually does not need more patience. It needs to be paused.
The stabilize row is just as important. Low-volume ad sets often look fixable because they have not spent much. But if they never reach enough weekly conversions, they may stay stuck in unstable delivery. In that case, the issue is not the offer or the ad alone. The structure itself is getting in the way.
Image alt text: budget allocation table for keep test pause Meta ad sets
How Do You Know If Low ROAS Is a Creative Fatigue or Offer-Message Problem?
When paid social ROAS drops below 1.0, two issues tend to show up again and again: creative fatigue or offer-message mismatch. They can look similar at first glance, but the pattern in the metrics tells a different story. Creative fatigue builds over time. The same audience keeps seeing the same ad, engagement slips, and costs climb. Offer-message mismatch is a different leak. In that case, the hook, headline, or promise does not line up with the audience’s pain points, or the ad sets one expectation that the landing page fails to meet.
Signs of Creative Fatigue
Creative fatigue usually appears in a familiar sequence: frequency climbs above 4.0, CTR drops, and CPC starts to rise. Hook rate is often the first warning light. When it falls below 30%, the ad usually is not stopping the scroll. Hold rate should stay above 15%.
Most creatives wear out within 2 to 4 weeks. That timeline matters because fatigue is not just a copy issue or a design issue. It is often a repetition issue. The audience has simply seen the ad too many times.
Accounts that test fewer than five new creatives per month often see a 15% month-over-month increase in CPA. That is why automated alerts matter. Set them to flag frequency once it moves past 4.0, so fatigue gets caught before ROAS slips even more.
If frequency stays flat, the problem is less likely to be fatigue. At that point, the next step is message fit.
Evaluate Message Clarity, Format, and Relevance
For prospecting campaigns, a CTR below 1.0% usually points to a hook or offer that is missing the audience. The value prop needs to land fast. State it in the first 3 seconds. On paid social, that window is tiny. If the message is vague, delayed, or buried, scrolls keep going.
Format carries as much weight as the copy itself. Bold on-screen text matters because most videos play muted. An ad can have a solid offer and still lose because the format does not make the message easy to grasp at a glance.
A simple way to think about it: fatigue means people have seen the ad too often; mismatch means they saw it and did not care. Those are not the same problem, and they should not get the same fix.
If the message is doing its job but purchases still lag, the leak is likely happening after the click.
Compare Creative Signals with a Performance Table
Symptom | Likely Cause | Primary Metric to Check |
|---|---|---|
Falling CTR, rising frequency | Creative fatigue | Hook Rate, Frequency (>4.0), Creative age |
High CTR, low CVR | Landing Page / Offer | Bounce Rate, Load Time, Message Match |
Low CTR, high CPM | Targeting / Audience | Audience Overlap, Geographic Breakdown |
High CTR, high add-to-cart, low purchase | Checkout Friction | Shipping Costs, Payment Options, Form Length |
These patterns make diagnosis a lot cleaner. Falling CTR with rising frequency usually points back to the ad itself. High CTR with weak CVR often means the click was won, but the landing page or offer lost the sale. Low CTR paired with high CPM tends to signal an audience issue. High add-to-cart with weak purchase volume often points to checkout friction, like shipping costs, payment gaps, or long forms.
Use these patterns to separate creative problems from post-click leaks. Budget split matters here too. A common approach is to put 70% to 80% of spend behind proven winners and 20% to 30% behind four to six new variants.
If the ad is earning clicks but sales still stall, the next place to inspect is the landing page and checkout.
How Do You Find Post-Click Conversion Leaks on the Landing Page and at Checkout?
If creative is earning clicks but ROAS still sits below 1.0, the leak is usually happening after the click. Strong click volume with weak return is a red flag that the problem sits on the site itself - most often on the landing page, in the cart, or during checkout.
Check Landing Page Alignment with the Ad
The most common leak is simple: the landing page does not match the ad. When an ad pushes 40% off a specific product bundle, that same offer needs to be visible above the fold as soon as the page loads. If shoppers land and have to hunt for it, many leave.
The headline, image, offer, and tone should mirror the ad. That message match helps confirm that the visitor landed in the right place. UTMs can also be used to tailor the landing page headline so the page lines up with the ad that drove the visit.
Audit Mobile Conversion Friction
Most landing page traffic comes from mobile, and pages that take more than 3 seconds to load lose more than half of users. That drop-off happens fast. A page may look fine in a desktop review and still fail where most shoppers actually arrive.
A mobile audit should focus on the points that slow people down or make the page harder to use:
Compress images to WebP under 200 KB, lazy-load assets, and remove unnecessary third-party scripts.
Use 44–48 px tap targets, apply the right input types for mobile forms, and remove sticky headers or pop-ups that crowd the screen or are hard to dismiss.
Checkout form length is another common leak. Adding a phone number field alone can cut conversions by 5%–15%, and forms with more than 8 fields often see conversion rates fall by over 30%. That is not a small dip. It is the kind of drag that can sink paid media performance even when ad engagement looks healthy.
Shipping costs and total price should also be clear early in the flow. When shoppers discover the full cost only at the final step, abandonment climbs.
If clicks are strong but purchases stall, the next move is to compare pre-click and post-click metrics side by side.
Separate Pre-Click from Post-Click Problems
Metric | Healthy Signal | What Low Performance Indicates |
|---|---|---|
CTR | >1.0% (prospecting) | Low CTR = weak creative or targeting |
CPC | Industry dependent | Low CPC + low ROAS = post-click leak |
CVR | 2.35%–6.6% | Below range = page speed, UX, or offer clarity issue |
Bounce Rate | <40% | High bounce, especially on mobile, = slow load or message mismatch |
This side-by-side view helps isolate the problem. Low CTR usually points to weak creative or targeting. Low CPC paired with low ROAS often points somewhere else entirely: the traffic is cheap enough to win clicks, but the site is failing to turn interest into revenue. When CVR drops below the normal range, page speed, UX, or offer clarity is often the issue. A high bounce rate - especially on mobile - usually signals slow load times or a mismatch between ad promise and landing page message.
If the site converts well, the next step is platform-level efficiency. If the site is clean, the next check is whether one platform is pulling blended performance down.
How Do You Compare Platform-Level Efficiency Across Meta, TikTok, and Other Paid Social Channels?
Paid social efficiency can look strong in-platform and still miss the mark in the business. Meta may show solid ROAS while backend sales stay flat. TikTok may look weak on last-click data while helping lift total revenue. That is why platform-level efficiency should only be compared after tracking, media, creative, and site checks are done. The right readout uses ROAS, CAC, CTR, CVR, and assisted revenue together to show whether one channel is hiding the real result or whether the issue runs across the whole program. Once that picture is clear, the fix list gets much easier to rank.
TL;DR
Platform comparisons should happen only after tracking, media, creative, and site issues have been checked.
ROAS, CAC, CTR, CVR, and assisted revenue should be reviewed together because platform ROAS alone can mislead.
Assisted revenue helps show when a channel supports sales even if it does not win last-click credit.
Platform-specific patterns often point to the root issue, from ad fatigue to landing page friction to attribution gaps.
Spend changes should follow reconciled data, not gut calls or dashboard snapshots.
Benchmark Channels by ROAS, CAC, and Assisted Revenue
Channel efficiency starts with reconciled revenue data, not what each ad platform claims on its own. Platform ROAS has a place, but it should not be the final judge. If Meta reports strong returns and backend revenue does not move, something is off. That gap may come from attribution settings, duplicate credit, or weak post-click performance.
CAC adds another layer. A channel can post decent ROAS and still bring in customers at a cost that strains margin. CTR and CVR help explain why. High click volume with poor conversion often means the ad is doing its job but the landing experience is not. Low CTR with rising CPM usually points back to the ad itself, the audience fit, or both.
Assisted revenue matters just as much. If pausing a channel lowers total sales, that channel is doing more than last-click reports show. GA4 and backend revenue data can help surface that contribution. This is where many teams get tripped up. A platform may look soft in surface-level reports yet still play a real role in demand creation and conversion support.
Use reconciled revenue data, not platform ROAS alone, to judge each channel.
Assisted revenue is another key signal. If pausing a channel lowers total sales, it is contributing beyond last-click credit. GA4 and backend revenue data can help surface that contribution.
A clean comparison often comes down to a simple question: does the platform report line up with what the business banked? If not, the dashboard is only telling part of the story.
Identify Platform-Specific Symptoms
The shape of underperformance usually shows where to look next. Not every weak result means the same thing, and treating all drops as a media problem wastes time.
Symptom | Likely Cause | Recommended Action |
|---|---|---|
High CPM / Low CTR | Creative fatigue or poor audience fit | Refresh creative; refine audience segments |
High CTR / Low CVR | Landing page friction or offer mismatch | Audit mobile load speed; align ad copy with the landing page headline |
High Frequency (>4.0) | Audience saturation | Broaden targeting or rotate creative assets |
Low ROAS / Unchanged Backend Revenue | Attribution or tracking gap | Implement CAPI; check GA4 assisted conversions |
This pattern readout keeps teams from making the wrong fix. A weak CVR does not always call for new targeting. Sometimes the ad is pulling the right people in, but the page is slow, the message shifts, or the offer falls flat when the click lands.
On Meta, high CPM with weak CTR usually points to creative fatigue or poor audience-message fit. In plain terms, the platform is paying more to show ads that people are not responding to. That tends to happen when the same assets have run too long, or when the message misses what the audience cares about right now.
On TikTok, the signals are a bit different. Declining Hook Rates below 30% and Hold Rates below 15% usually point to a creative issue, not a targeting issue. If viewers drop in the opening moments, the problem often sits in the first frame, the pace, the angle, or the setup. TikTok rewards momentum. If the ad does not pull people in fast, performance can slide before downstream metrics even have a chance.
Meta and TikTok Fatigue at Different Speeds
Meta and TikTok do not wear out the same way. That difference matters when teams compare efficiency across channels.
TikTok creative tends to fatigue faster. Ads often need refreshes every few days to keep response rates from slipping. The feed moves fast, users consume a lot of content, and repeated exposure burns through novelty in a hurry. A TikTok ad that worked on Monday can feel old by Thursday.
Meta usually gives assets a bit more room. In many cases, performance can hold with creative refreshes every 2–4 weeks. That does not mean Meta is immune to fatigue. It just means the decay curve often looks less abrupt.
This difference can distort cross-channel comparisons if one platform is maintained tightly and the other is left to coast. A tired TikTok account can look like a targeting failure when the real issue is refresh timing. A Meta account can appear stable for a while, then quietly lose efficiency as frequency climbs and CTR softens.
For that reason, platform-level efficiency should always be read in context:
How often creative is refreshed
How fast frequency is climbing
Whether audience size can support current spend
Whether the landing page experience matches each platform’s traffic pattern
Without that context, teams may cut a channel that still has room to work or scale one that is living on borrowed time.
Decide Whether to Scale, Stabilize, or Pull Back
Once channel data is reconciled, the next move becomes more practical. Some channels are ready to scale. Some need stabilization. Some should lose budget. The key is to decide with clean signals, not with platform-reported optimism.
Scale only the channels with clean attribution and steady efficiency. If ROAS, CAC, CVR, and backend revenue line up, increased spend has a stronger case. Stabilize channels with mixed signals. That may mean holding budget flat while fixing creative fatigue, landing page friction, or audience saturation. Pull back only after data is reconciled and the channel still underperforms.
That last point matters. Low in-platform ROAS with no drop in backend revenue can point to an attribution gap, not a media failure. On the other hand, weak ROAS paired with weak backend sales is a much cleaner sign that the channel is not pulling enough weight.
Use these channel signals to rank fixes by impact and confidence. A channel with high CTR and low CVR may need site work before any media change. A channel with high frequency and falling CTR may need new creative first. A channel with mismatched platform and backend reporting may need CAPI work and GA4 review before budget decisions mean much.
FAQ
How should paid social channels be compared fairly?
Paid social channels should be compared only after tracking, media setup, creative health, and site performance have been checked. Then ROAS, CAC, CTR, CVR, and assisted revenue can be reviewed together against backend revenue.
Why is platform ROAS not enough?
Platform ROAS can overstate channel value because each platform reports through its own attribution lens. Backend revenue and GA4 data help show whether reported returns match business results.
What does assisted revenue tell a marketing team?
Assisted revenue shows whether a channel helps drive sales even when it does not get last-click credit. If sales drop after a pause, the channel may be doing more work than standard attribution reports show.
What usually causes high CTR but low CVR?
That pattern often points to landing page friction or an offer mismatch. The ad is earning attention, but the page may load slowly, shift the message, or fail to carry through on the promise made in the ad.
How do Meta and TikTok differ when performance drops?
Meta often shows fatigue through rising CPM, soft CTR, and climbing frequency. TikTok often shows trouble earlier through weak Hook Rates and Hold Rates, which usually signals a creative issue.
TL;DR Summary
Platform comparisons should happen only after tracking, media, creative, and site issues have been checked. Otherwise, teams may blame the wrong channel for a problem caused elsewhere.
ROAS, CAC, CTR, CVR, and assisted revenue should be reviewed together because platform ROAS alone can mislead. A single metric rarely shows the full business picture.
Assisted revenue helps show when a channel supports sales even if it does not win last-click credit. That is especially useful when upper-funnel channels look weaker in standard platform reports.
Platform-specific patterns often point to the root issue, from ad fatigue to landing page friction to attribution gaps. Reading those patterns well helps teams fix the right thing first.
Spend changes should follow reconciled data, not gut calls or dashboard snapshots. Clean data leads to cleaner scale, steadier stabilization, and smarter pullbacks.
CTA Block
Need a clearer read on paid social efficiency across Meta, TikTok, and other channels? Schedule a Bigeye paid media audit to review attribution, platform reporting, creative fatigue, landing page friction, and backend revenue alignment. Our team can help sort which channels should scale, which need stabilization, and which should lose budget based on the numbers that matter.
What Should You Fix First When Paid Social ROAS Drops Below 1.0?
When paid social ROAS drops below 1.0, the fastest way back is not a full account overhaul. The smart move is to fix the highest-confidence problems first: tracking, wasted spend, tired creative, and post-click friction. Once tracking and channel signals are clear, changes should be ranked by confidence and time to impact. Changing everything at once usually muddies the picture and burns more budget.
TL;DR
Tracking should be fixed first because broken CAPI or duplicate purchase events make every later decision less reliable.
Budget waste should be cut next by pausing ad sets that have already spent 2x–3x target CPA without a conversion.
Creative fatigue should be addressed when CPM rises and CTR falls on the same assets.
Landing-page and checkout issues should be checked when CTR stays healthy but ROAS remains below 1.0.
Prioritize by Impact and Confidence
The highest-confidence fix is tracking. If CAPI is broken or purchase events are duplicated, every optimization move that follows rests on bad data. Measurement comes first, full stop.
Once data integrity is confirmed, the next step is budget waste. Ad sets that have spent 2x–3x target CPA without a conversion should be paused to stop the bleed. Meta Ads Manager kill rules can do this automatically before more spend disappears.
Creative fatigue comes after that. When the same assets start showing a familiar pattern - higher CPM and lower CTR - it usually means the audience has seen too much of the same thing. In plain terms, the ad is wearing out.
If CTR still looks healthy but ROAS stays below 1.0, the problem is likely happening after the click. That usually points to landing-page friction, checkout issues, or a weak handoff from ad promise to page experience.
The table below helps sort fixes by urgency and expected speed.
Fix Category | Priority | Time to Impact |
|---|---|---|
Tracking (Pixel/CAPI) | Critical | Immediate (data accuracy) |
Automated kill rules | High | 24–48 hours |
Creative refresh | High | 3–7 days |
Landing page speed | Medium | Immediate (post-click) |
New audience tests | Medium | 7–14 days |
Build a 7-Day and 30-Day Action Plan
After the account is stable, the work should split into a 7-day triage plan and a 30-day test plan.
The first seven days are for stabilization, not growth. That means checking Pixel and CAPI health in Events Manager, looking for deduplication errors, pausing weak ad sets, reviewing top-spend creative for fatigue signals, and fixing mobile landing-page friction found in the audit. Budget shifts should stay under 20% so the account does not reset the learning phase .
The 30-day window is where testing starts to matter. Around 20–30% of budget should go to new creative hooks and UGC-style formats. Seed audiences should come from the top 20% of customers by lifetime value instead of leaning on broad interest targeting. For accounts that run across more than one geography, U.S. ad sets should be split from lower-cost international markets so delivery does not drift toward cheaper impressions that look efficient on the surface but hurt sales quality. Scaling should wait until ad sets reach about 50 purchase or conversion events per week .
Request a Paid Social Audit from Bigeye
Ready to find where ROAS is breaking down? Schedule a Bigeye paid social audit to get a clear fix list ranked by impact and confidence.
What Is the Right Order to Fix a Paid Social ROAS Under 1.0?
Diagnose a ROAS under 1.0 in this order: tracking, media structure, audience, creative, then post-click conversion. Start with tracking because every later call depends on clean data.
Data comes first because attribution gaps make every later move shaky. Once tracking is confirmed clean, move to media structure and budget allocation. Audit creative only after tracking and structure are clean. If CTR holds but ROAS stays below 1.0, check the landing page and checkout last.
Audit Stage | Key Focus Area | Critical Check |
|---|---|---|
1. Tracking | Tracking Integrity | Pixel + CAPI match quality, UTM consistency |
2. Media Structure | Media Efficiency | Campaign overlap, budget allocation, bidding rules |
3. Audience | Targeting Quality | LTV-based seeds, exclusion of recent buyers |
4. Creative | Offer-Message Fit | Creative fatigue, Hook/Hold rates, UGC usage |
5. Post-Click | Landing Page and Checkout | Page load speed (<3 seconds), mobile UX, CTA clarity |
Use this order to isolate the first break in performance before changing spend, creative, or landing pages. Next, verify tracking and attribution before changing spend or creative.
With the order set, the first audit step is tracking and attribution.

Consumer Research & Insights
Jul 21, 2026
Baby Boomer targeting works best by life-stage segments, clear pricing, proof-led messaging, and a search+email-first channel mix in 2026.