Brand Tracking for Consumer Brands
Brand tracking reveals early warning signs of brand health shifts months before they hit revenue. For consumer brands, this means spotting declining loyalty or stagnant consideration before competitors gain ground. By the end of this article, you'll understand how to measure key metrics like awareness, preference, and loyalty, connect them to financial outcomes, and use these insights to guide strategy.
TL;DR:
Brand tracking measures awareness, consideration, preference, and loyalty over time to assess market position.
Early shifts in brand health predict revenue changes 6–12 months in advance.
Consistency in survey design ensures accurate trend data for actionable insights.
Metrics like Net Promoter Score (NPS) and Category Entry Points (CEPs) help identify strengths and weaknesses.
Advanced tools streamline data collection, analysis, and decision-making for faster, reliable insights.
What Are the Core Components of a Brand Tracking Program?
A brand tracking program relies on three interconnected elements: funnel metrics that map the consumer journey, health KPIs that assess your brand's competitive positioning, and survey design that ensures the data collected is reliable. Together, these components form a feedback loop where any weak link can compromise the insights. When executed properly, they provide the foundation for actionable data and strategic decision-making.
Brand Funnel Metrics to Track
Brand funnel metrics capture the consumer's journey from initial exposure to your brand through to repeat purchases and advocacy. Each stage answers a distinct strategic question, making it essential to track more than just awareness.
Funnel Stage | What It Measures | Why It Matters |
|---|---|---|
Awareness | Unaided and aided recall | Highlights mental availability and top-of-funnel reach |
Consideration | "Would consider" (Top-2 Box), shortlist incidence | Demonstrates whether awareness leads to relevance |
Preference | First-choice brand, price premium willingness | Reflects competitive strength and pricing power |
Usage | Past 3-, 6-, or 12-month purchase, penetration | Links perception to actual consumer behavior |
Loyalty | Repeat rate, NPS, share of wallet | Indicates stability and reduced acquisition costs |
A critical distinction lies in unaided awareness - when a consumer recalls your brand without prompting. This is a stronger indicator of mental availability compared to aided awareness, which tends to produce higher but less predictive scores. Modern tracking programs are also incorporating Category Entry Points (CEPs), which identify the specific situations or cues that trigger brand recall. For example, a moment like "feeling thirsty after a workout" could link directly to a hydration product.
Real-world examples illustrate the impact of funnel metrics. BluePeak, a $700M hydration brand, leveraged funnel data in Q1 of a recent year to address stagnant market share despite aggressive promotions. While awareness was high at 78%, loyalty metrics revealed a significant issue - only 6% of customers were repeat buyers, and price premium willingness had dropped. By adjusting pack sizes and focusing on taste cues identified through driver analysis, BluePeak boosted consideration by 6 points and usage penetration by 2 points within two quarters. The result? A 6.2% increase in incremental revenue.
The same approach applies in high-trust categories like skincare, where consumers evaluate ingredients, claims, proof points, sustainability, and brand credibility before they buy. Skincare marketing trends show why tracking perception, consideration, and loyalty is essential for understanding whether a brand’s messaging is actually building trust.
While funnel metrics outline consumer behavior at different stages, brand health KPIs provide a broader view of market strength.
Key Brand Health KPIs
Health KPIs complement funnel metrics by evaluating the overall strength of your brand's market position. Key metrics include Trust, Relevance, Differentiation, and Perceived Value, which collectively indicate whether your brand is positioned for sustainable growth. Additionally, Net Promoter Score (NPS) remains a cornerstone metric for loyalty, calculated as the percentage of promoters (scores of 9–10) minus detractors (scores of 0–6).
Media and communication metrics further enhance this picture. These include:
Advertising Awareness: Tracks whether consumers recall seeing your ads.
Buzz: Measures the sentiment of conversations about your brand.
Word of Mouth Exposure: Reflects how often your brand comes up in conversations.
As The Research Agency explains:
"Long-term growth comes from strengthening mental availability and emotional connection, rather than relying on short-term advertising bursts or price-led activity."
Survey Design and Sampling
Accurate survey design is the backbone of reliable brand tracking. Even the most advanced metrics are meaningless if the underlying survey is flawed. Sampling quality is the most critical variable, as the reliability of your tracker depends on the source of your data. For national tracking in the U.S., a sample size of 800–1,200 respondents per wave ensures a margin of error of ±2–3 points.
The sequence of survey questions is equally important. Start with unaided awareness before moving to aided awareness, consideration, and attribute ratings. Reversing this order can bias respondents and inflate early-funnel scores. Consistency in question phrasing across waves is also crucial. As Timelaps cautions:
"If your vendor 'optimizes' question phrasing between waves, your trend data could likely be noise."
To maintain data integrity, implement fraud detection measures like behavioral fingerprinting and algorithmic checks. Short, focused surveys help reduce respondent fatigue and improve data quality across waves.
How Can Brand Tracking Data Drive Real Growth for Consumer Brands?
Brand tracking data is a powerful tool for identifying where your brand is excelling and where it may be falling short along the consumer journey. This data provides actionable insights that can shape marketing strategies, moving beyond intuition or delayed sales metrics. As Henk Pretorius, Co-founder of Timelaps, explains:
"Revenue is the lagging indicator. Brand is the leading one."
Changes in brand equity often surface 6–12 months before they impact financial performance, offering teams the opportunity to adjust strategies before revenue is affected. By analyzing these early signals, brands can uncover strengths and areas for improvement across the consumer journey.
Identifying Brand Strengths and Weaknesses
One key insight from brand tracking is understanding where consumers drop off in the funnel. For instance, high awareness but low consideration often points to issues with positioning or distribution rather than reach. Simply increasing media spend without addressing these underlying problems risks wasting resources.
Brand tracking also highlights Category Entry Points (CEPs) - the situations, needs, or moments that drive purchase decisions. A brand might dominate a specific use case but remain invisible in others, creating opportunities for growth. Segmenting this data by demographics or purchase frequency can expose underperforming groups, while cohort analysis - tracking new, retained, and lost customers - helps pinpoint where intervention is needed to prevent churn.
Connecting Insights to Marketing Strategy
Once weaknesses are identified, brand tracking data can guide both media and creative strategies. Media indexing allows brands to focus on channels where their target audience is overrepresented compared to the category average. For example, if consideration scores are slipping within a specific audience, these insights can refine targeting efforts.
Key Driver Analysis (KDA) takes this further by identifying which brand attributes most influence purchase decisions. For example, if "trustworthy ingredients" resonate more with consumers than "great taste" for a food brand, this insight should shape messaging. As Josh Shames, Managing Director, US at Hall & Partners, observes:
"If your brand tracking can't help you earn permission to sell and charge more, it's not so much tracking as it is theater."
To ensure insights remain actionable, align data reviews with key business events - such as product launches or creative campaigns - rather than fixed reporting schedules. This approach keeps findings relevant and timely.
Tying Brand Data to ROI
One of the biggest challenges for marketing leaders is linking brand metrics to financial results. The connection is clear: a $1 increase in brand value corresponds to a $1.76 rise in turnover and a $0.16 increase in net income. Brand strength can account for up to 30% of total revenue, making it essential to treat brand health as a measurable asset rather than an abstract concept.
Correlating metrics like consideration or NPS with sales growth helps justify continued brand investment. Marketing Mix Modeling (MMM) can further isolate the long-term impact of brand-building efforts from short-term promotional gains, providing finance teams with a clearer view of ROI. Brands that consistently measure and communicate their equity are better equipped to defend budgets during economic downturns compared to those relying solely on awareness metrics. Integrating these insights into always-on dashboards ensures marketing decisions are both immediate and data-driven.
What Does Brand Tracking Software Actually Do for Consumer Brands?
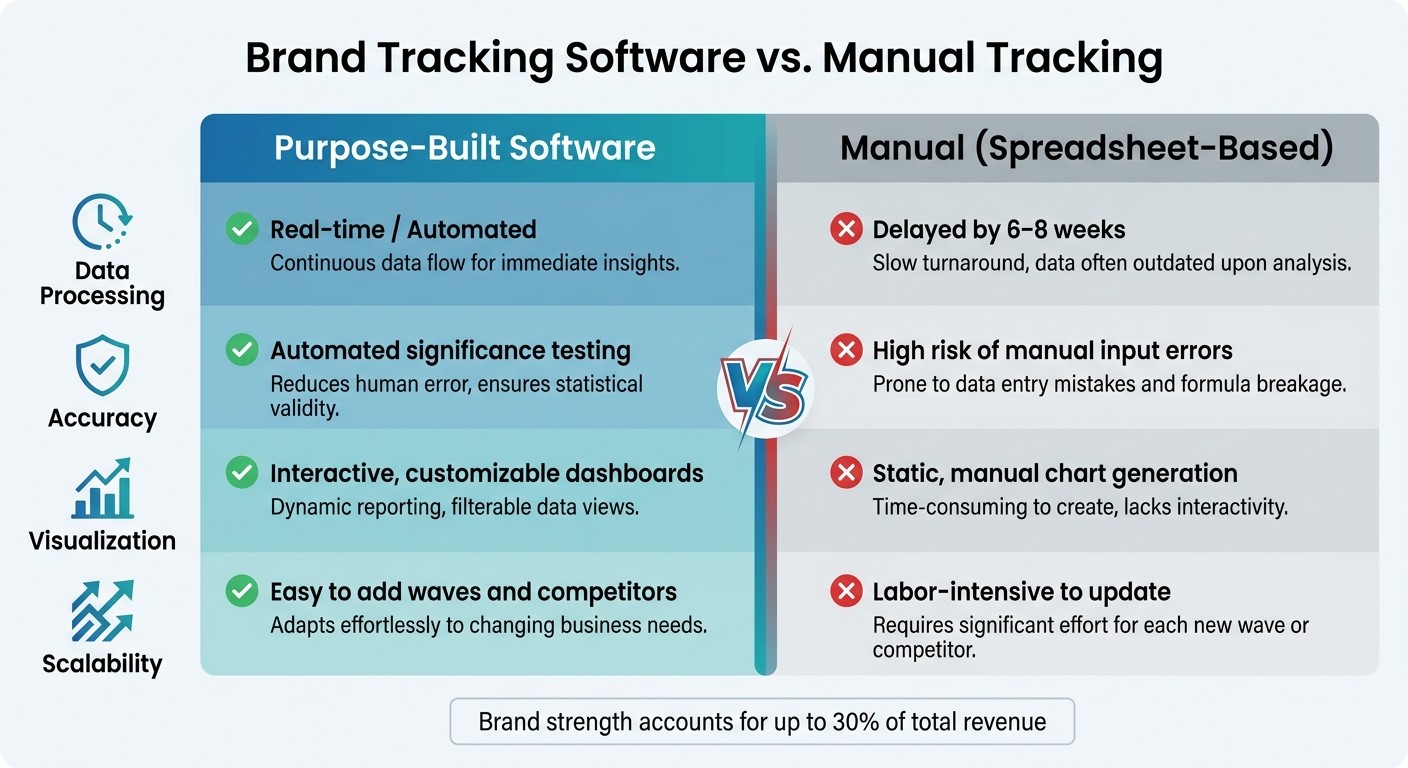
Brand Tracking Software vs. Manual Tracking: Key Differences
Brand tracking software replaces slow, manual processes with an automated system that delivers real-time insights into brand health. This speed and precision are critical for consumer brands to adjust strategies on the fly and demonstrate ROI. For fast-paced industries like food & beverage or retail, cutting the time between data collection and decision-making is especially important.
Key Features of Brand Tracking Platforms
The best brand tracking platforms provide far more than survey tools. They offer competitor benchmarking across over 1,000 brands and detailed audience segmentation based on demographics, psychographics, and media habits. This helps brands identify underperforming consumer groups with precision.
Another essential feature is automated significance testing, which flags statistically meaningful shifts without requiring manual cross-referencing between survey waves. This reduces errors and ensures attention is focused on the most critical changes. Additionally, AI-powered fraud detection screens out bots, rushed responses, and low-quality data before it can skew results.
"QuestBrand's real-time data provides a continuous view into consumer response to our marketing initiatives." - Rob Harvath, VP of Consumer Insights and Data Management at Citizen Watch Group
These tools create a streamlined workflow, delivering continuous insights in real time.
How a Brand Tracking Workflow Runs
A robust brand tracking program follows a structured timeline. During the first 30 days, objectives are aligned, KPIs defined, and the questionnaire is designed - starting with unaided awareness to avoid biasing respondents. Days 31–60 are dedicated to fielding the study and setting up dashboards. By days 61–90, initial results are reviewed, and a regular cadence (monthly or quarterly) is established.
Consistency in methodology is critical. Questions should remain unchanged between waves to maintain trend accuracy. Assigning a dedicated owner to oversee the process ensures that the program remains methodologically sound.
Software vs. Manual Tracking
The difference between purpose-built software and manual tracking methods lies in scalability and efficiency.
Feature | Purpose-Built Software | Manual (Spreadsheet-Based) |
|---|---|---|
Data Processing | Real-time / Automated | Delayed by 6–8 weeks |
Accuracy | Automated significance testing | High risk of manual input errors |
Visualization | Interactive, customizable dashboards | Static, manual chart generation |
Scalability | Easy to add waves and competitors | Labor-intensive to update |
While manual tracking might work for a one-time audit, it becomes unmanageable when tracking multiple competitors, running frequent surveys, or sharing insights across teams. For consumer brands, the efficiency of software is essential for guiding active campaigns and building stakeholder trust.
"Having access to the raw data and being able to pull out what's most relevant, is, I think, a real game changer." - Lisa Rosenberg, Partner and President of Consumer Brands at Allison
For brands that need data to guide live campaigns and inform stakeholders - not just annual reviews - brand tracking software is indispensable. Bigeye’s brand strategy services leverage proprietary consumer research to ensure campaigns are built on reliable data, not assumptions.
How Do You Read and Act on Brand Tracking Results Without Getting Lost in the Data?
Turning raw data into actionable insights requires a clear focus on trends over time. Isolated figures can mislead, but tracking the trajectory across multiple waves helps identify meaningful changes while filtering out statistical noise.
Spotting Trends and Diagnosing Issues
A temporary dip in awareness doesn’t signal a crisis. The real value lies in monitoring conversion rates between funnel stages over time. Are these rates improving, staying flat, or declining across waves? This approach provides a clearer picture of brand health. As Timelaps explains:
"A brand with strong awareness but weak awareness-to-consideration conversion has a positioning problem."
Instead of relying solely on fixed quarterly reviews, align data analysis with key market events like product launches, ad campaigns, or competitor moves. This event-driven approach allows quicker adjustments and ties performance shifts to specific actions. Advanced tools like Key Driver Analysis (KDA) can also pinpoint which brand attributes drive purchase decisions, ensuring efforts focus on metrics that influence outcomes.
Once you’ve identified trends, take a closer look at specific consumer groups to refine your strategy.
Segment Analysis for Targeted Insights
Relying on aggregated data can obscure critical shifts within particular segments. For example, overall awareness for a brand might appear stable, but a closer look could reveal significant changes among "at-risk" or "heavy" buyers. Breaking down data by purchase frequency and brand relationship uncovers these hidden dynamics, enabling more targeted messaging and strategies.
Another tool to sharpen insights is Category Entry Points (CEPs). These measure not just whether consumers recognize your brand but when they think of it - specific need states or occasions that drive consideration. For a food & beverage brand, this might mean distinguishing between "quick weekday breakfast" and "weekend indulgence." Tailoring creative messaging to these moments often improves conversion rates. Bigeye’s consumer research capabilities are designed to uncover these nuanced audience behaviors, ensuring survey insights directly inform actionable strategies.
However, even the best insights depend on the quality of the underlying data.
Data Quality and Bias Reduction
Reliable insights start with clean, accurate data. Panel fraud and AI-generated survey responses pose risks, as they can distort findings if not properly filtered. To avoid this, implement rigorous fraud checks to screen out bots and low-quality participants before they compromise results.
Consistency across survey waves is equally essential. For instance, if your Wave 3 sample skews older than Wave 2 due to quota inconsistencies, any apparent drop in brand preference might stem from sampling differences rather than genuine market changes. Regularly auditing sample composition is critical. Additionally, keep surveys concise to prevent respondent fatigue, which can lead to careless or random answers and undermine the validity of segment analyses.
"Data quality will make or break your research study. If you have a ton of respondents but they provide illegitimate responses... you're not basing your business decisions on true target audience perceptions." - quantilope
What Are the Most Important Things to Know About Brand Tracking for Consumer Brands?
Brand tracking offers a structured way to identify early consumer signals that predict future purchasing patterns, providing a forward-looking advantage over sales data, which only reflects past performance.
The brand funnel is the foundation of any effective tracking program. Key stages like awareness, consideration, preference, usage, and advocacy each carry distinct strategic implications. For example, a brand with high awareness but low consideration likely faces a positioning challenge rather than a media issue. This makes conversion rates between funnel stages just as critical as the raw numbers at each level.
Consistency in data collection is non-negotiable. Panel fraud and inconsistent sampling can distort trends, rendering insights unreliable. Maintaining identical question wording and sampling quotas across waves is essential for generating meaningful trend data. As Langston succinctly put it:
"The best Wave 1s are designed to be Wave 2s."
Modern tracking methods now incorporate Category Entry Points and Mental Market Share, which provide deeper insights into competitive dynamics beyond simple brand recall. This evolution has pushed many food & beverage and retail brands to adopt monthly tracking cadences as the norm by 2026.
To maximize the impact of brand tracking, align your KPIs with metrics approved by finance teams. This ensures every insight contributes to actionable business decisions. Connecting brand equity improvements to measurable commercial outcomes - supported by always-on dashboards - turns tracking into a dynamic tool for shaping marketing strategy. Bigeye's consumer research capabilities are built with this in mind: every insight must lead to a decision that matters. These principles not only reinforce the credibility of your tracking data but also ensure your marketing efforts are driven by actionable intelligence.
FAQs
How often should we run brand tracking?
Most consumer brands see strong results from conducting brand tracking either monthly or quarterly. This cadence allows them to keep a close eye on market shifts and adapt swiftly - an essential approach for fast-moving sectors like food, beverages, and personal care.
What sample size do we need per wave?
The sample size for each wave needs to strike a balance between statistical reliability and budget constraints. Allocate larger samples for comprehensive annual analyses to capture detailed insights. For quarterly pulse checks, opt for smaller samples that still provide actionable data without overspending. This approach ensures cost-effective research while maintaining data quality.
How do we connect brand metrics to revenue?
To tie brand metrics directly to revenue, focus on linking indicators such as awareness, consideration, and brand equity to measurable outcomes like sales and profit. Tools like marketing mix modeling (MMM) are commonly used for this purpose. MMM dissects both short- and long-term effects, isolating baseline demand changes that stem from brand-building activities. This approach provides clear insights into how branding efforts contribute to financial performance.
Which funnel metrics matter most?
The primary funnel metrics for brand tracking include awareness, consideration, preference, usage, and loyalty. Awareness metrics, such as unaided recall and aided recall, measure how effectively the brand is recognized by consumers. On the other hand, loyalty metrics - like retention rates and Net Promoter Score (NPS) - provide insight into the brand's long-term health and customer commitment. By monitoring conversion rates between these stages, brands can pinpoint performance gaps and refine marketing strategies to fuel growth.
What’s the difference between aided and unaided awareness?
Aided awareness gauges whether consumers recognize a brand when given prompts, such as a list of names or visual cues. This metric highlights how familiar a brand is when hints are provided. On the other hand, unaided awareness measures whether consumers can recall a brand on their own, without any external prompts. This reflects how top-of-mind a brand is for consumers. Together, these metrics provide a comprehensive view of brand health - aided awareness emphasizes recognition, while unaided awareness showcases a brand’s prominence in consumer memory.
When should we use NPS vs. loyalty metrics?
Net Promoter Score (NPS) is a powerful tool for assessing long-term customer loyalty and the overall health of your brand. By tracking how likely customers are to recommend your brand, NPS provides a reliable benchmark for loyalty trends over time.
While CSAT (Customer Satisfaction Score) focuses on specific interactions, like how satisfied a customer feels after a transaction, NPS takes a broader view. Combining NPS with other metrics like CSAT and CES (Customer Effort Score) delivers a well-rounded picture of customer loyalty. NPS offers strategic insights into brand perception, while CSAT and CES provide operational data to fine-tune the customer experience. Together, they create a comprehensive framework for understanding and improving loyalty.
What are Category Entry Points (CEPs)?
Category Entry Points (CEPs) are the specific moments or situations that prompt consumers to consider entering a product or service category. These triggers shape how and when consumers recall and evaluate brands, playing a critical role in aligning brand messaging with consumer motivations and decision-making behaviors. By understanding CEPs, brands can position themselves to be top-of-mind when it matters most.
How do we avoid survey bias across waves?
To reduce survey bias across multiple waves, assign persistent participant IDs to track respondents consistently, ensuring data remains reliable. Use identical wording, questions, and response options in each wave to maintain comparability. Anticipate participant drop-off by beginning with a large enough sample size, providing incentives, and keeping respondents engaged through reminders and personalized outreach. These steps strengthen the reliability of longitudinal data and insights.
How do we spot real changes vs. noise?
To identify genuine changes rather than random fluctuations, focus on analyzing trends over consistent data collection periods. Keep survey questions consistent to maintain comparability, and ensure any observed shifts surpass expected variance levels. Additionally, account for external influences and verify the stability of your sample to ensure the reliability of your findings.
What should a brand tracking dashboard show?
A brand tracking dashboard must focus on critical metrics such as brand awareness, consideration, preference, and loyalty to provide a clear picture of brand health. Including consumer perception indicators like relevance, trust, and sentiment adds depth to the analysis. To make the data actionable, use clear visual tools like charts and interactive filters (e.g., breaking data down by demographics or regions). Incorporating trend indicators is essential for spotting performance changes and shaping effective marketing strategies.

Pet Industry
Jul 2, 2026
Pet marketing trends show transparency, channel-fit, and subscriptions are the keys to winning first purchase and driving repeat loyalty.