
The CMO Guide to Proving Retail Media ROI
Retail media spending is booming, with global ad spend expected to hit $197 billion by 2026, including $69.33 billion in the U.S. Yet, proving its true return on investment (ROI) is a growing challenge for CMOs. Traditional metrics like ROAS often overestimate impact by failing to account for incremental sales - those directly caused by ads. With advertisers managing six retail media networks on average (projected to grow to 11), inconsistent data and attribution methods add to the complexity.
To make smarter budget decisions, CMOs need to focus on incrementality testing, which measures causal lift, and metrics like iROAS (Incremental ROAS) and iROI (Incremental ROI) to isolate true profit impact. Building a unified measurement system, consolidating fragmented data, and aligning with Finance on profitability metrics are key steps to overcoming these challenges. This guide explores how to measure retail media ROI effectively, optimize spending, and gain confidence in your marketing investments.
What Retail Media ROI Actually Means
ROAS vs. iROAS vs. True Profitability: What Each Metric Really Tells CMOs
Let’s break down what retail media ROI is really about, especially in light of the challenges we’ve already discussed.
At first glance, ROAS (Return on Ad Spend) seems like a straightforward way to measure success. It shows how much attributed revenue you earn for every dollar spent on advertising. But here’s the catch: ROAS doesn’t tell you if the ads actually drove those sales or if those customers would’ve made the purchase anyway.
Tobi Dele, Ad Operations Team Lead at Vantage, explains it well:
"ROAS tells you how efficiently spend turned into attributed sales, but it doesn't tell you whether the campaign actually caused those sales to happen."
True retail media ROI digs deeper. It’s about causal lift, which measures the incremental sales or profit your advertising generates - sales that wouldn’t have happened without the ad. For CMOs managing budgets, two key metrics come into play: iROAS (Incremental Return on Ad Spend) and iROI (Incremental Return on Investment).
iROAS focuses on net-new revenue by stripping out baseline organic conversions.
iROI goes even further, factoring in contribution margins and costs to show the true profit impact.
For finance teams, iROI is especially critical because it ties directly to profitability rather than platform-reported revenue.
Comparing Key Metrics
Here’s a quick look at how these metrics differ and what they reveal:
Metric | Calculation | What It Actually Tells You |
|---|---|---|
ROAS | Total Attributed Revenue ÷ Ad Spend | Efficiency in spend but includes organic sales, often inflating performance |
iROAS | Incremental Revenue ÷ Ad Spend | Focuses on net-new growth by isolating sales caused by the ad |
iROI | Incremental Profit ÷ Ad Spend | True profitability; accounts for margins and costs |
One common pitfall is cannibalization, where ad spend ends up capturing sales that would’ve happened anyway. Without incrementality testing, a campaign might show impressive ROAS numbers, but in reality, it’s just taking credit for organic purchases. This is the difference between metrics that look great in a dashboard and those that can hold up in a boardroom discussion.
Understanding retail media ROI through this lens lays the groundwork for building a robust measurement framework.
How to Build a Retail Media Measurement Framework
To prove ROI effectively, you need accurate and complete data. A strong retail media measurement framework relies on four key inputs: sales data (both online and in-store), media spend, retailer fees, and baseline performance (your organic sales without advertising). Missing even one of these elements can leave critical gaps in your ROI analysis.
This means unifying data from online orders, in-store POS transactions, app purchases, and click-and-collect pickups into a single, cohesive view. Additionally, you’ll need ad exposure data that ties viewable impressions and clicks to a specific user identity. Loyalty IDs and logged-in account emails provide a direct connection between an ad and a verified purchase. With privacy regulations becoming stricter, probabilistic signals are no longer reliable for accurate measurement.
By 2026, only 15% of advertisers will strongly trust their retail media measurement. Considering the U.S. retail media market is expected to reach $69.33 billion by 2026, evaluating such significant investments with limited confidence poses a serious risk. This makes building a reliable measurement system more urgent than ever.
"Marketing and finance teams are now aligning around a common question: What is the incremental business impact of this investment?" - Mark Baum, Chief Collaboration Officer & Senior Vice President, Industry Relations, FMI
Three-Layer Measurement System
The most effective frameworks approach measurement through three interconnected methodologies:
Marketing Mix Modeling (MMM): Helps with high-level budget allocation across channels.
Multi-Touch Attribution (MTA): Focuses on identifying which touchpoints contribute to conversions for optimization.
Incrementality Testing: Determines whether an ad directly caused a purchase or if the sale would have occurred anyway.
Methodology | Question It Answers | Best For |
|---|---|---|
MMM | How should I split budget across channels? | Strategic budget planning |
MTA | Which touchpoint deserves credit for this conversion? | Daily optimization and bid strategy |
Incrementality | Did the ad cause this purchase, or would it have happened anyway? | Channel justification and proving lift |
Setting Up Consistent Reporting Logic
One of the biggest challenges in retail media reporting is the lack of consistency across different platforms. For example, Amazon reports performance at the SKU level, Meta organizes by audience, and Google structures reports by keyword. Without a unified system, comparisons become unreliable.
The solution? Consolidate all retailer data into a centralized environment - whether it’s a data warehouse like Snowflake or BigQuery, or a Customer Data Platform (CDP) - and apply standardized reporting rules. For instance, in early 2026, the jewelry brand Awe Inspired integrated Shopify, Cin7, and its marketing platforms into Google BigQuery with Looker Studio for reporting. This streamlined approach led to a 10% increase in conversion rates and a 50% reduction in reporting workload.
To enable accurate cross-network comparisons, standardize attribution windows. For example, align Amazon’s 14-day window with Walmart’s 7-day window.
Another critical aspect is distinguishing between working and non-working dollars. Working dollars are the funds directly spent on running ads, while non-working dollars cover expenses like retailer data fees, market research, and platform costs. Mixing these can distort spend efficiency and obscure actual profitability.
"Lack of analytics access is the excuse; lack of ownership is the problem." - Megan Conahan, EVP of eCommerce, Direct Agents
Bigeye, which manages paid media across platforms like Amazon, Walmart, Target, and Instacart, emphasizes that brands benefit most when they start with a clean, standardized data infrastructure. Your framework doesn’t need to be flawless on day one, but it must be consistent. This consistency provides the foundation for a clear view of retail media performance and ensures you can validate ROI with confidence.
How to Measure Incrementality in Retail Media
Once you’ve established a measurement framework, the next big question is whether your retail media spend is truly creating new demand or simply taking credit for sales that would’ve happened anyway. This distinction is critical for understanding the real impact of your advertising efforts.
At its core, incrementality measures the causal lift in sales generated by your advertising, stripped of factors like organic demand, seasonality, or baseline performance. As of 2024, a striking 71% of advertisers rank incrementality as the top KPI for retail media investments. Traditional attribution models tend to overestimate the contribution of lower-funnel channels, such as branded search, by 100–400%, while undervaluing upper-funnel prospecting efforts by 30–60%. Without incrementality testing, you risk misinterpreting where your budget is actually delivering value.
The gold standard for measuring incrementality is through holdout experiments. For example, in a geo-based holdout test, you divide markets into matched pairs, running ads in test regions while withholding them in control regions. By comparing sales differences, you can evaluate the true impact of your campaigns, including cross-channel halo effects, without requiring retailer collaboration. For even more granular insights, ghost bidding allows you to create matched user cohorts - one group sees the ads while the other doesn’t - without wasting budget or contaminating your control group. The calculation is simple: (Test Group Sales − Control Group Sales) / Control Group Sales.
The results can be eye-opening. For instance, in 2024, Mondelez used Walmart Connect’s Search Incrementality feature to fine-tune ad frequency and rotate seasonal creative assets. The result? A 53% year-over-year increase in conversions and a 29% boost in incremental ROI. Another example: a beauty brand running campaigns across Amazon, Ulta, and Sephora in 2025 used geo-based holdout testing. The findings? An iROAS of 2.8x for Amazon, 1.2x for Ulta, and just 0.7x for Sephora. By reallocating 30% of the Sephora budget to Amazon, they achieved a 22% increase in total incremental sales.
"Incrementality testing is the only methodology that proves your marketing actually causes conversions, rather than just correlating with them. Attribution tells you who touched the ball; incrementality tells you who actually scored." - Rahul Verma, Senior Product Manager, AdsMAA
If full-scale experimentation isn’t an option, you can use New-to-Brand (NTB) sales, market share lift, and conversion rates by touchpoint as directional indicators. Once you gather your test results, apply calibration multipliers - dividing incremental sales by attributed sales - to adjust your daily reporting. This ensures your metrics reflect the true impact of your campaigns, not just the numbers reported by platforms. It’s a shift from focusing on what happened to understanding why it happened - and whether your investment made it happen.
Calculating True Profitability Beyond ROAS
Understanding the real profitability of your campaigns goes beyond just looking at ROAS. While ROAS measures how efficiently you're spending, it doesn't account for the full picture, such as costs and actual profit margins. To make smarter budget decisions, you need to dig deeper into the numbers.
A better approach involves factoring in key unit economics like Cost of Goods Sold (COGS), fulfillment fees, pick-and-pack costs, return rates, and retailer-specific fees. For example, a campaign showing a 4x ROAS might still lose money if the product has thin profit margins or high return rates. The formula for true profitability looks like this:
(Revenue − COGS − Fulfillment − Returns − Ad Spend) on a per-unit basis.
This method builds on the idea of incremental impact by incorporating both cost structures and cross-channel effects. It highlights the importance of a more complete measurement framework to truly understand campaign performance.
The Role of Indirect Costs
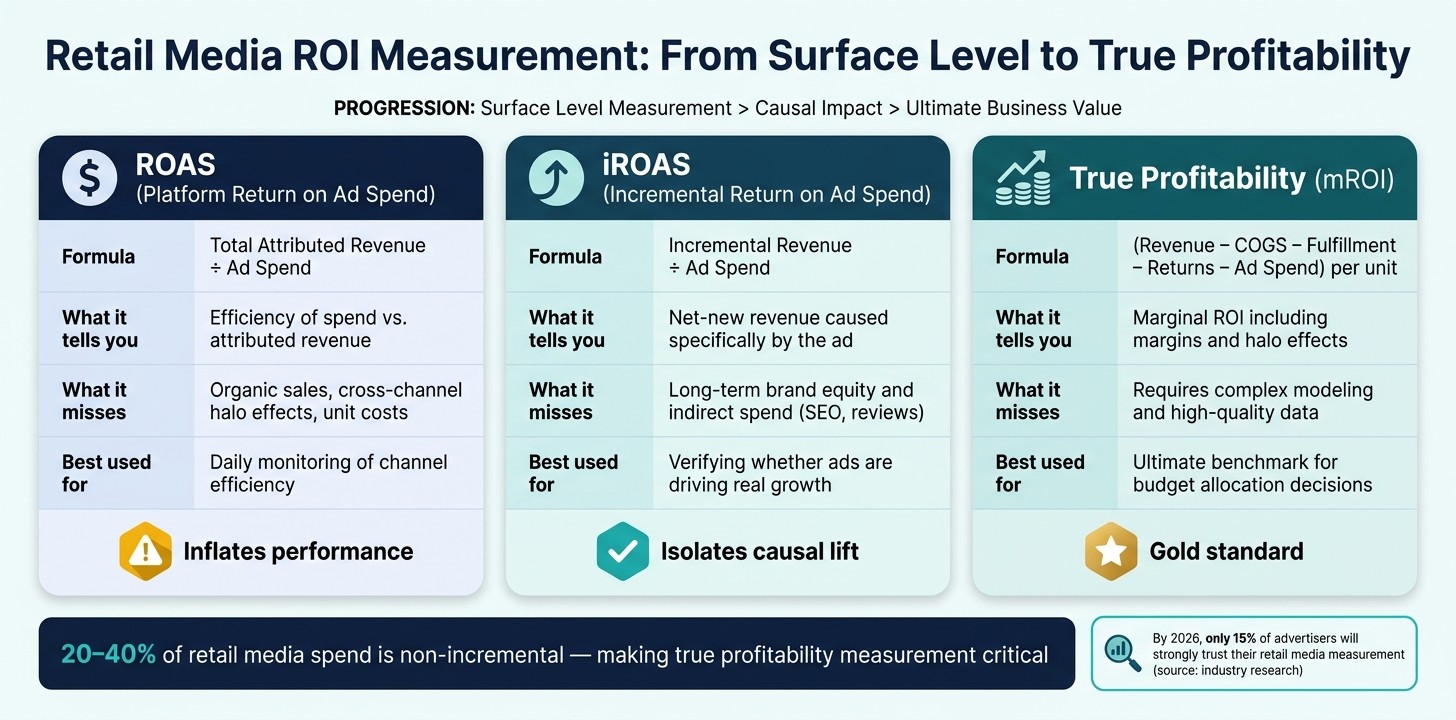
Indirect expenses - often overlooked - also play a big role in profitability. These include costs like SEO optimization, managing customer reviews, and creating content tailored for specific retailers. These expenses don’t usually show up in platform dashboards but directly affect whether a campaign is worth running. Ignoring these costs can lead to distorted profitability assessments. In fact, research indicates that 20% to 40% of retail media spend is non-incremental, meaning a good chunk of what looks profitable might not be driving actual business value.
The Hidden Benefits of Cross-Channel Impacts
Sometimes, true profitability can be higher than what ROAS suggests. For instance, an Amazon ad might inspire a customer to make a purchase in a physical store - a benefit that won’t show up in the platform’s metrics. Overlooking these cross-channel effects can lead to undervaluing campaigns that contribute to offline sales.
"If you were to add up all the ROAS metrics reported by individual platforms, the implied revenue would often far exceed your actual business results - clear evidence that platforms take credit for overlapping or external impacts." - Bradley Keefer, Chief Revenue Officer, Keen
Comparing Key Profitability Metrics
Each metric offers a unique perspective, and relying on just one can give you an incomplete - or even misleading - picture.
Metric | What It Measures | What It Misses |
|---|---|---|
Platform ROAS | Efficiency of spend vs. attributed revenue | Organic sales, cross-channel halo effects, and unit costs |
Incremental ROAS (iROAS) | Net-new revenue caused specifically by the ad | Long-term brand equity and indirect spend (SEO, reviews) |
True Profitability (mROI) | Marginal return on investment including margins and halo effects | Requires complex modeling and high-quality data to calculate accurately |
To achieve this level of precision, many brands are optimizing spend with marketing mix modeling to account for variables that platform-level data often misses.
The Takeaway
Use platform ROAS for daily monitoring of channel efficiency, iROAS to verify whether your ads are driving real growth, and true profitability as your ultimate benchmark for deciding where to allocate your budget. No single metric tells the whole story, but combining these can help you make well-rounded decisions.
Building a Unified View of Retail Media Performance
Many CMOs today are juggling retail media data scattered across multiple dashboards - Amazon Seller Central, Walmart Connect, Meta Ads Manager, Google Ads, and various retailer-provided tools. The issue isn’t a lack of data; it’s the inconsistency between platforms. A telling statistic: 33% of CMOs rely on 6 to 15 different tools to measure marketing performance, yet only 37% have a centralized data lake that’s accessible to all stakeholders.
To address this, a unified data solution is essential for consolidating insights across channels. The first step? Establishing a single source of truth - a centralized data warehouse like Snowflake or Google BigQuery, or a Customer Data Platform (CDP). These systems allow data from all channels to be deduplicated and normalized before analysis. For instance, in February 2026, the fine jewelry brand Awe Inspired integrated data from Shopify, Cin7, Airtable, GA4, Facebook, and Zendesk into a Google BigQuery warehouse. This move not only streamlined operations but also provided SKU-level demand visibility alongside marketing performance metrics, enabling faster and more confident decision-making that aligned with their retail media ROI goals.
While centralization tackles data fragmentation, privacy challenges remain. One significant hurdle is the "walled garden" problem - platforms like Amazon and Walmart often restrict access to raw user data, making it difficult to connect ad exposure to purchase behavior across channels. A promising workaround is Data Clean Rooms - privacy-safe environments such as Amazon Marketing Cloud (AMC) or Google Ads Data Hub. These tools allow brands to combine their first-party data with retailer exposure data without exposing raw records. The integration of clean rooms with a centralized data warehouse further strengthens unified measurement capabilities. Notably, as of September 2025, Amazon made AMC access free for all Sponsored Ads advertisers, making cross-channel analysis more accessible for brands of all sizes.
Another critical step is standardizing data. Platforms report metrics differently - Amazon at the SKU level and Meta at the audience level - which complicates cross-channel comparisons. Without consistent definitions for events like "view", "click", "add to cart", and "purchase" across platforms, even a unified dashboard can produce conflicting numbers, leading to debates instead of actionable decisions.
Unified data isn’t just about cleaner reports; it’s about enabling smarter budgeting decisions. Finance and executive teams increasingly expect this level of integration, and for good reason. Retailers that unify customer data across all touchpoints achieve 85% higher sales growth. By bringing retail media data together with search, social, and commerce metrics in one view, brands can stop optimizing channels in silos and instead allocate budgets to the areas driving the most incremental growth across their entire portfolio.
Using ROI Data to Make Better Budget Decisions
Having a unified view of retail media performance can turn insights into smarter spending choices. With 84% of CMOs focusing on ROI and 70% of retail media budgets being shifted from traditional channels, every dollar matters.
Once you’ve consolidated your data, the next step is to separate spending that maintains existing demand from spending that drives growth. Branded search and retargeting campaigns often target shoppers already planning to purchase, safeguarding current sales but not expanding your customer base. On the other hand, upper-funnel strategies like CTV or social prospecting introduce your brand to entirely new audiences. Both approaches serve a purpose, but treating them equally in your budget can lead to inefficiencies. Tracking new-to-brand (NTB) conversions is a useful way to distinguish growth-focused spending from retention-driven efforts.
A practical tool to refine this process is Marginal Incremental ROAS (miROAS), which measures the return on the next dollar spent rather than relying on historical averages. While average ROAS might look promising, it can hide saturation points where additional investment no longer delivers meaningful results.
"The competitive advantage no longer comes from tracking more, it comes from allocating better under uncertainty." - Noah Atwood, Go Fish Digital
Beyond channel-level metrics, it’s essential to examine product-level impacts. For instance, SKU-level cannibalization can occur when high-ROAS campaigns promote discounted products, drawing sales away from higher-margin, full-price items. This creates a false sense of performance while eroding profit margins. Catching this issue early allows you to redirect budgets toward channels that deliver true incremental growth.
Rules for Long-Term Portfolio Optimization
Achieving sustainable retail media performance means setting adaptable rules that evolve with market changes. Many successful CMOs use a "Suite of Truth" framework, combining three key measurement tools to guide budget decisions:
Methodology | Question It Answers | Best For |
|---|---|---|
MMM | "How should I split budget across channels?" | Strategic macro-budget planning |
MTA | "Which touchpoint deserves credit for this conversion?" | Daily campaign optimization and bidding |
Incrementality | "Did the ad cause this purchase, or would it have happened anyway?" | Validating true lift and channel spend |
miROAS | "What is the return on the next dollar spent?" | Identifying saturation and reallocation points |
In addition to these tools, it’s important to establish clear reallocation triggers in collaboration with your finance team. For example, if a channel’s miROAS falls below a set threshold, funds should automatically shift to higher-performing tactics. This approach eliminates bias from reallocation decisions and aligns Marketing and Finance around contribution margins after returns and fulfillment costs, rather than just focusing on top-line GMV.
With Amazon and Walmart expected to capture 89% of incremental retail media spending by 2026, having disciplined criteria based on transparent data and identity resolution is essential. At the same time, avoid letting performance media overshadow upper-funnel efforts. Retail media thrives when a steady stream of aware, interested shoppers feeds into it. Upper- and lower-funnel spending should complement each other, not compete.
Bigeye, for example, manages paid media across platforms like Google, Meta, Amazon, TikTok, YouTube, and over 50 retail media networks. Brands that succeed in sustaining growth understand the importance of balancing these efforts effectively.
Conclusion: Making Confident Retail Media Investment Decisions
Proving the return on investment (ROI) for retail media requires a system that brings together data, finance, and strategy in harmony. With the U.S. retail media market expected to hit $69.33 billion by 2026, and advertisers currently juggling an average of six retail media networks - set to grow to 11 by the end of the year - the cost of fragmented and unreliable measurement is becoming harder to ignore.
To navigate this complexity, combine multiple measurement approaches, including Marketing Mix Modeling (MMM), incrementality testing, and platform data. Implement metrics like miROAS to identify saturation early and shift budgets effectively. Collaborate with Finance to define contribution margins before campaigns even begin. These steps create a foundation for stronger governance and sharper budget management.
One major obstacle is the issue of platforms over-crediting revenue. As one industry leader notes, aggregated platform ROAS often inflates actual revenue by attributing overlapping impacts. This highlights the critical need for accurate measurement and tighter financial controls. Retail media attribution should function as a financial control system, not just a performance dashboard. When Marketing and Finance teams align on definitions and clear reallocation triggers, budget decisions become faster, less contentious, and more rooted in real business outcomes.
The CMOs who excel in retail media won’t necessarily be the ones with the biggest budgets. Success will belong to those who understand why their investments deliver results - and can back it up with evidence. By aligning data, finance, and strategy, CMOs can turn retail media insights into smarter, more impactful investment decisions.
FAQs
How do I calculate iROAS vs. ROAS?
ROAS, or Return on Ad Spend, is a metric that evaluates the total revenue generated from advertising efforts. It’s calculated by dividing the total revenue by the amount spent on ads. In contrast, iROAS, or Incremental Return on Ad Spend, zooms in on the additional revenue directly driven by advertising. This is determined by dividing incremental revenue - sales that wouldn’t have occurred without the ads - by the ad spend.
While ROAS provides a snapshot of overall campaign efficiency, iROAS digs deeper, isolating the actual contribution of ads by excluding organic sales. This distinction helps marketers focus their budgets on driving truly new revenue.
What incrementality test should I run first?
A geo-holdout experiment is a great way to test incrementality. This method involves pausing your campaign in specific geographic areas while keeping other variables steady. By comparing performance in these test areas to similar control markets, you can determine the actual lift caused by your campaign. For example, one retailer found that real conversion increases were smaller than what their attribution models predicted, demonstrating how valuable this approach can be for uncovering accurate results.
How do I prove profit, not just revenue?
To show profit rather than just revenue, focus on measuring incremental sales and the real effects of your retail media campaigns. Techniques like incrementality testing can help pinpoint the sales increase that goes beyond your baseline performance. Additionally, using closed-loop attribution with first-party transaction data lets you link ad exposure directly to confirmed purchases. This approach ensures you're evaluating profit accurately by factoring in costs and isolating the true sales growth generated by your campaigns.

Pet Industry
Jul 2, 2026
Pet marketing trends show transparency, channel-fit, and subscriptions are the keys to winning first purchase and driving repeat loyalty.


