Social Media Engagement Rate Benchmarks by Industry
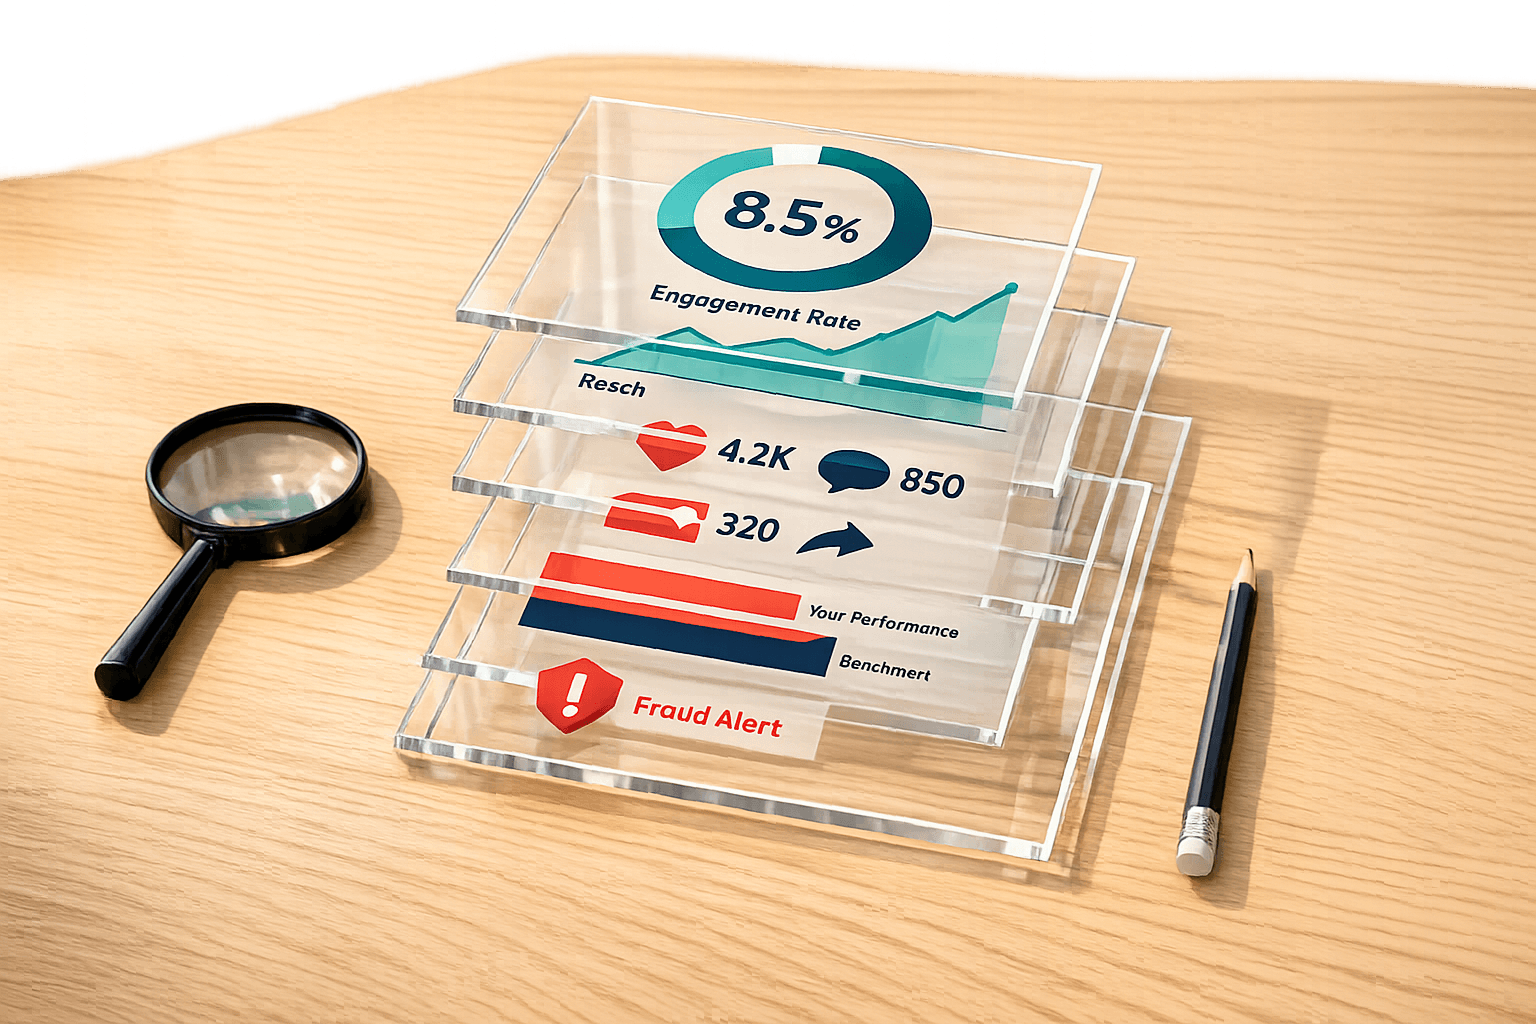
A 0.26% Instagram engagement rate and a 3.80% rate can both be “right” for the same industry. That gap is why social media engagement rate benchmarks confuse so many teams. I’d use this article to check what these numbers mean, which industries tend to run high or low, and how to compare my brand to a benchmark without using the wrong math.
TL;DR
Social media engagement rate benchmarks only help when I match the same engagement metrics, platform, and time frame.
TikTok, Instagram, and LinkedIn often lead engagement, but the top channel changes by industry.
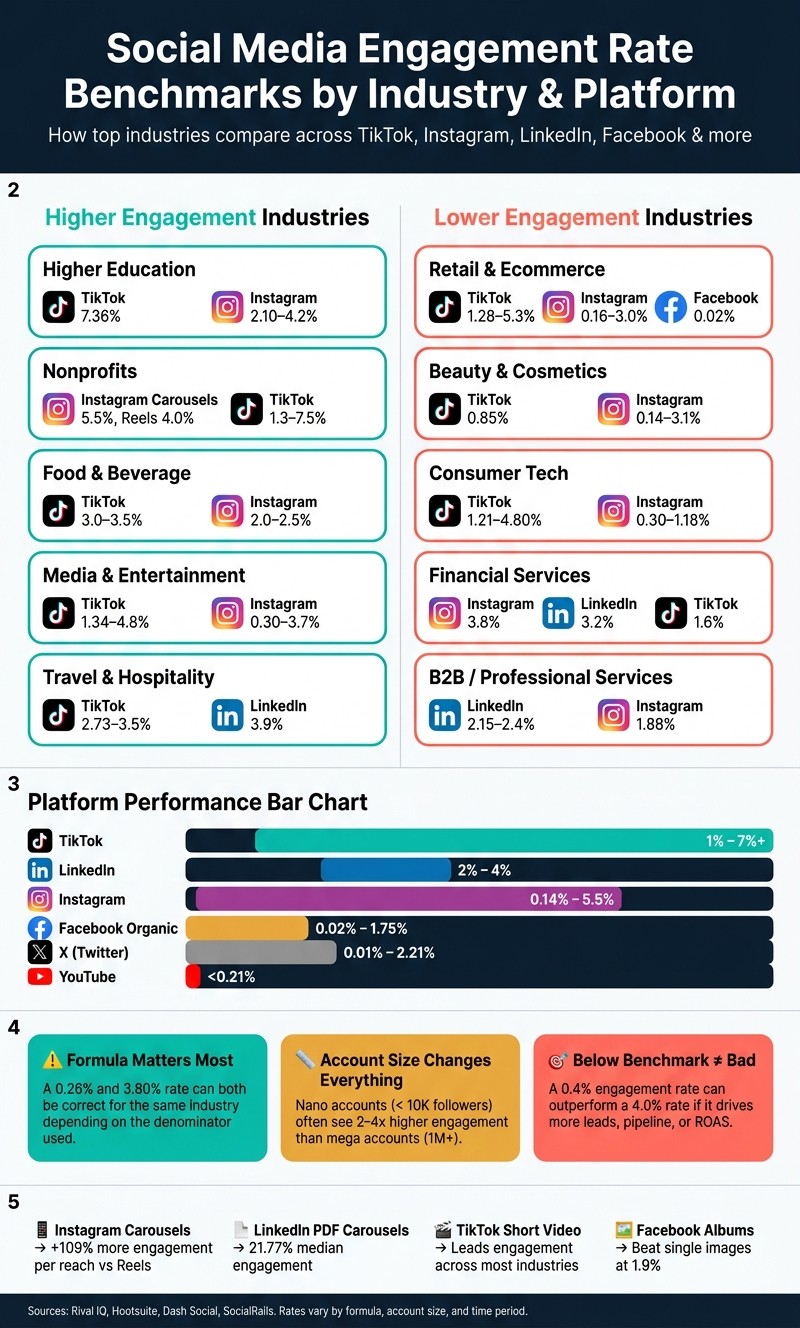
Higher education, nonprofits, food, and media often post stronger engagement than retail, tech, and finance.
Lower engagement does not always mean weak performance, especially for B2B, finance, and conversion-focused content.
I should use benchmarks to frame results, then check clicks, leads, sales, and ROAS before making a call.
Why social media engagement rate benchmarks are easy to misread
The main takeaway is simple: the formula changes the story.
A follower-based rate, a reach-based rate, and an average per-post rate are not the same thing. If I compare one against another, I can end up with a bad read on performance.
That issue showed up all through the article. The clearest example was financial services on Instagram:
0.26% from one source using follower-based median
3.80% from another using per-post average
That is a huge spread, but it does not mean one report is wrong. It means the denominator changed.
My rule would be: compare math first, results second.
Which industries tend to post the highest and lowest engagement?
Some categories get more interaction because the audience has more reason to respond in public.
Industries that often post stronger engagement:
Higher education
Nonprofits
Food and beverage
Media and entertainment
Travel and hospitality
These groups often get more comments, shares, and saves because the content ties to identity, emotion, mission, or daily life.
Industries that often post lower engagement:
Retail
Beauty
Consumer tech
Financial services
B2B and professional services
That does not mean the marketing is weak. It often means the audience is less likely to react with likes and comments, or the content sits lower in the funnel.
Platform trends matter more than one blended benchmark
The article’s core point was not “pick one good number.” It was check each platform on its own.
Across many industries:
TikTok often led engagement, with many categories landing around 1% to 7%+
Instagram stayed strong, especially for carousels, Reels, tutorials, and lifestyle posts
LinkedIn worked well for B2B, finance, retail, and travel when the content taught something
Facebook organic often sat near the bottom on follower-based studies
X was mixed and usually weak outside live updates, sports, news, or niche technical talk
YouTube often showed lower engagement rates, even when view counts were high
That means I should not ask, “What is a good social engagement rate?” in the abstract. I should ask:
What is a good rate for my industry?
On this platform?
Using this formula?
For this content type?
Content format changes results fast
The article made one point again and again: format can swing engagement just as much as channel choice.
A few patterns stood out:
Instagram carousels often beat Reels for saves and deeper interaction
Reels and TikTok videos often pulled more reach
LinkedIn PDF carousels posted very high engagement in B2B settings
Facebook albums often beat single-image posts
Short, personality-led videos worked well in travel, retail, and media
Expert-led education worked well in health, wellness, finance, and B2B
So if my numbers look weak, I would not jump to “the platform is bad.” I’d check whether the format fits the job first.
Account size changes benchmark ranges
This is one of the most useful parts of the article.
Small accounts often post much higher engagement than large ones. That pattern showed up in retail, travel, and B2B.
Examples from the article included:
Nano Instagram accounts in retail reaching around 2.5% to 4.0%
Large retail brands with 1 million+ followers landing closer to 0.3% to 0.5%
Nano travel TikTok accounts hitting up to 4.7%
Mega travel accounts often sitting around 1.0% to 2.0%
So if I run a large brand page, comparing my numbers to blended industry averages can lead me the wrong way. I would benchmark against brands closer to my audience size.
The strongest industry-level patterns from the article
Social Media Engagement Rate Benchmarks by Industry & Platform
Here is the short version of what the article showed, without repeating every table.
Retail and ecommerce
Retail often posts some of the lowest engagement rates because feeds are crowded and product-first posts blend in. TikTok and LinkedIn looked better than Facebook. Personality-led content, series-based video, and carousels tended to beat plain product shots.
CPG, food, and beverage
Food and CPG usually beat retail because people react to recipes, use cases, and product demos. TikTok and Instagram were the top channels. Saves matter a lot here because they often hint at buying intent.
Beauty, health, and wellness
This category split in two. Beauty often faced heavier saturation, while wellness and healthcare did better when they leaned into trust, education, routines, and expert clips. Saves and shares mattered more than likes.
Consumer tech
Tech engagement was often lower than teams expect. TikTok and LinkedIn stood out most. Demos, how-tos, founder stories, and swipeable explainers worked better than polished promo posts.
Travel and hospitality
Travel did well when content mixed humor, utility, and brand voice. TikTok, Instagram, and LinkedIn all had room to perform. Short clips and personality-led posts beat polished destination-only content.
Media and entertainment
Story quality mattered more than volume. Sports accounts often beat general media. Shares looked more useful than likes for judging what had audience value.
Nonprofits
Mission-led content often posted strong engagement, especially on Instagram and TikTok. Posts with a direct ask - vote, sign, donate, share - tended to beat passive awareness posts.
Higher education
This was one of the strongest categories in the article. Student-led TikToks, campus pride, athletics, and milestone content often drove high engagement. Posting less did not always hurt results much.
Financial services
Finance can post good engagement, but the category moves slower because of review cycles and compliance. Instagram and LinkedIn looked like the best organic bets. Educational carousels and explainer posts fit well here.
Professional services and B2B
Raw engagement was often lower than consumer categories, but each interaction could mean more. LinkedIn was the main platform. Employee advocacy and PDF carousels stood out.
How I’d compare my brand against social media engagement benchmarks
The article closed with the part that matters most: how to compare fairly.
I’d line up these five factors before making any call:
Formula
Follower-based, reach-based, impression-based, and per-post rates tell different stories.Time period
Q4 holiday marketing traffic is not the same as Q1 or summer.Audience size
A page with 8,000 followers should not be judged against a page with 8 million.Campaign goal
Awareness content and conversion content should not be graded the same way.Format
A carousel, Reel, album, and long-form video behave very differently.
If those five things do not match, the benchmark is weak at best.
When a below-benchmark engagement rate is still fine
This was one of the better points in the article.
A post can sit below benchmark and still do its job.
That is common when the content is built for:
Demo requests
Leads
Email sign-ups
Add-to-cart actions
Purchases
High-intent clicks
A post with 0.4% engagement can beat a post with 4.0% engagement if it drives more pipeline or sales.
So I would never stop at likes, comments, and shares. I’d pair engagement with:
CTR
Conversion rate
Lead quality
ROAS
Revenue
Save rate
Share rate
FAQ
What is a good social media engagement rate by industry?
There is no single good rate. It changes by industry, platform, account size, and formula. A strong rate for higher education or nonprofits may look high for finance or B2B.
Which platform has the highest engagement rate?
In many of the article’s examples, TikTok led. But LinkedIn was strong for B2B and finance, and Instagram stayed strong for many consumer categories.
Why are engagement benchmarks so different across reports?
Most of the spread comes from different formulas. Some
What Engagement Rates Should Retail and Ecommerce Brands Actually Expect on Social Media?
Retail and ecommerce brands face some of the lowest social media engagement rates in the market, and that’s not a small detail - it changes how you should judge performance. This space is crowded, scroll-heavy, and hard to stand out in. As Maria Mundaden of Rival IQ/Quid put it:
"Retail and Beauty struggled to stand out... A saturated market hurt Beauty & Retail, which had the lowest engagement across platforms."
That’s why one broad retail benchmark doesn’t tell you much. The better read is platform by platform.
Platform benchmarks swing a lot based on how each source calculates engagement. Instagram, for example, ranges from 0.16% to 3.00% here because the measurement methods differ. TikTok comes out on top, with retail brands averaging between 1.28% and 5.3% depending on the source. Facebook organic sits near the floor, with medians around 0.02%. LinkedIn stands out in the other direction: retail and consumer goods brands average between 3.9% and 4.15%, and video content reaches 4.3% engagement there.
Platform | Rival IQ (Median) | Hootsuite (Average) |
|---|---|---|
0.16% | 3.00% | |
TikTok | 1.28% | 1.60% |
0.02% | 1.00% | |
N/A | 3.90% | |
X (Twitter) | 0.01% | 1.70% |
Sources: [3]
Account size also has a huge effect on these numbers. Nano-accounts with fewer than 10,000 followers can see Instagram engagement between 2.5% and 4.0%. Large-brand accounts with more than 1 million followers often land between 0.3% and 0.5%. Put simply, a big brand comparing itself to a blended retail average may be comparing apples to oranges.
Content format is one of the few levers retail brands can control directly. On Instagram, carousels drive 109% more engagement per person reached than Reels. Reels tend to work better for top-of-funnel reach, while carousels earn more saves and deeper interaction. On Facebook, albums beat single images at 1.9% engagement. On TikTok, Footasylum pushed engagement above 7% by leading with original entertainment series like Bad Bistro and on-street interviews instead of product-first posts.
The bigger shift in retail is clear: brands are moving away from product-led visuals and toward brand-led storytelling. Retail brands tend to get more engagement when the content leads with personality, not a plain product shot:
"A defined brand identity is a key engagement driver... Recent top-performers are building original content series and personality-driven content where products play a supporting role."
For retail and ecommerce teams, the smart move is to judge performance through the lens of platform, format, and account size first. Retail can be your baseline, but it often helps to compare against categories where audience intent is stronger and interaction comes more naturally.
What Engagement Rates Should CPG, Food, and Beverage Brands Expect on Social Media?
CPG and food brands tend to beat retail on engagement. The reason is pretty simple: recipes, product demos, daily routines, and easy use cases give people something to react to. On TikTok, both food and beverage brands and CPG brands average 3.0% to 3.5% engagement rates. Instagram comes next, with 2.0% to 2.5% for food and beverage and 2.5% to 3.0% for CPG. Facebook organic performance drops hard, landing around 0.03% to 0.08%.
Dining and restaurant brands do even better than the broader category on some platforms. On Instagram, they average 3.52%, and on Facebook, 1.58%. Alcohol brands are much lower across the board: 1.76% on TikTok, 0.37% on Instagram, 0.07% on Facebook, and 0.02% on X. That gap is why subcategory benchmarks are more useful than one broad industry number.
Platform | Food & Beverage Avg. ER | CPG Avg. ER | Best-performing content |
|---|---|---|---|
TikTok | 3.0%–3.5% | 3.0%–3.5% | Short-form video |
2.0%–2.5% | 2.5%–3.0% | Reels, carousels | |
0.03%–0.08% | ~0.06% | Giveaways, product hacks |
Content style plays a big role here. Close-up product shots, texture-heavy visuals, and recipe demos keep pulling stronger engagement for CPG and food brands on TikTok and Instagram. In late 2025, Pine-Sol reached an 18.25% engagement rate on its top post by leaning into a comedic brand voice instead of product education.
On Instagram, saves can matter more than likes because they hint at purchase intent. A person who saves a recipe, meal idea, or product use tip may be planning to come back when it's time to buy. TikTok views for CPG brands climbed 66% while engagement stayed steady, and Instagram Reels views were up 20%. When views go up but engagement stays flat, that usually means reach is growing faster than interaction.
What Engagement Rate Benchmarks Should Beauty, Health, and Wellness Brands Expect on Social Media?
Beauty, wellness, and healthcare brands don’t play by the same social media rules. Audience intent changes everything. Beauty often leans aspirational, while healthcare depends far more on trust. That split has a big effect on engagement. Beauty also tends to face heavier saturation than wellness, which puts pressure on interaction rates.
Healthcare, pharma, and biotech show a different pattern across platforms: they tend to lag on TikTok and Instagram but do better on LinkedIn. Fitness and wellness, though, often act more like consumer lifestyle brands than clinical ones.
Platform | Health / wellness / healthcare benchmark | Beauty & Cosmetics Benchmark | Top Format |
|---|---|---|---|
TikTok | 2.3% | 0.85% | UGC and text overlays |
1.8%–3.7% | 0.14%–3.1% | Carousels for engagement, Reels for reach | |
1.9% | 0.02% | Albums, health tips | |
3.3% | N/A | Expert-led educational content |
Instagram makes the gap even easier to see. In the same follower range, fitness and wellness brands often beat beauty brands because tutorials and motivational posts get more saves.
That difference carries straight into content strategy. SunSip posted a 25% TikTok engagement rate with UGC and text overlays, while AG1 averaged 136,000 views per video and 77% retention with short expert-led clips. Those numbers stand out because the content favors trust, utility, and repeatable formats over polished promotion.
For brands in these spaces, saves and shares matter more than likes. They show a stronger signal that someone wants to come back to a tutorial, routine, or product use case. From there, the useful move is to stack these benchmarks against your own account size and content mix.
What Engagement Rate Benchmarks Should Consumer Technology Brands Expect on Social Media?
Consumer tech social media engagement is often lower than brands expect, and that’s normal. For most consumer technology brands, TikTok and LinkedIn stand out, while Instagram sits in the middle and Facebook, YouTube, and X tend to post lower rates. The key thing to watch isn’t just the platform. It’s the mix of format, audience intent, and how the rate was calculated. For consumer tech, demos, how-tos, and use-case content usually get the most interaction, especially when the post gets to the point fast.
Platform | Tech Engagement Rate | Top-Performing Format |
|---|---|---|
TikTok | 1.21% – 4.80% | Quick demos, tech tips, founder stories |
1.8% – 3.6% | PDF carousels, launch announcements | |
0.30% – 1.18% | Carousels, Reels | |
YouTube | < 0.21% | Long-form tutorials |
0.02% – 0.08% | Industry news, product updates | |
X (Twitter) | 0.02% – 0.08% | Real-time updates, developer-focused discussions |
Use this table as a starting point, not a scorecard. Before you compare your numbers to any benchmark, line up the formula first. Some sources use follower-based engagement, others use reach, and others look at per-post interaction. If the math doesn’t match, the comparison falls apart.
The biggest jumps usually come from content type, not just platform choice. Put simply, format matters almost as much as where you publish. On Instagram, carousels tend to drive more saves and shares than Reels, even though Reels often pull more raw reach. That difference matters for tech brands trying to explain a product, show features, or walk users through a use case.
LinkedIn is another good example. Native document carousels are especially strong, with median engagement hitting 21.77%. That’s a big signal for brands with a B2B motion, or for consumer tech companies that also need to speak to buyers, partners, investors, or industry press. A launch post may get attention, but a swipeable deck that teaches something often gets more action.
TikTok plays by its own rules. Speed matters more than polish. Tech brands need to hook viewers in the first two seconds, and product demos under 10 seconds tend to do better for completion rates and distribution. That makes sense: if a post drags, people scroll. Founder stories and day-in-the-life videos also tend to beat standard promo posts, mostly because they feel less like ads and more like something worth watching.
X is now a weaker channel for most consumer tech brands. There is one clear exception: developer-focused tools. In that case, real-time technical conversations can still drive solid interaction. If your product lives in a space where builders want to trade notes in public, X can still pull its weight. If not, it’s often a low-return channel.
One last point is worth repeating because it trips up a lot of teams: match the benchmark formula to your own reporting before comparing results. A 2% engagement rate can mean very different things depending on whether it was based on followers, reach, or post impressions. Without that context, you’re not comparing apples to apples.
What Engagement Rate Benchmarks Should Travel, Hospitality, and Leisure Brands Expect on Social Media?
Travel gives marketers a sharp point of comparison: engagement goes up when posts mix inspiration, useful information, and a bit of personality. In travel, hospitality, and leisure, engagement swings hard from one platform to the next. TikTok and LinkedIn sit at the top, while Facebook organic engagement is close to the bottom.
Platform | Benchmark | Top-Performing Format |
|---|---|---|
TikTok | 2.73% – 3.5% | Short-form personality-led video |
3.9% | Video (4.5% avg) | |
0.34% – 3.52% | Carousels (3.7% avg) | |
0.06% – 1.58% | Albums (2.4% avg) | |
X (Twitter) | 0.01% – 2.14% | Replies, status updates |
One of the biggest changes in travel social right now is the move away from polished destination shots and toward personality-led, utility-driven content. Dash Social's 2026 Travel and Hospitality Industry Benchmark Report says it clearly:
"Previously, travel content focused on scenic views and destination highlights. Now, travel brands incorporate more humor, creators, and brand voice to stand out in crowded feeds."
You can see that change most clearly in short-form video and practical updates that give people a reason to stop scrolling. NYC Ferry hit a 38.5% engagement rate on TikTok in the second half of 2025 by leaning into comedic, personality-led posts. KAYAK pulled in more than 60.8 million YouTube views between July and December 2025 with short, comedic clips that highlighted product simplicity, while holding a 99% audience retention rate.
There’s another signal here, and it’s hard to ignore: travel brands are posting less often on YouTube, yet views have climbed 181%. That points to a simple takeaway. Shorter, more deliberate clips are beating longer destination tours.
Before you judge whether a number is good or bad, compare it against account size. In travel, nano-accounts on TikTok can reach engagement rates as high as 4.7%, while mega-accounts usually land between 1.0% and 2.0%. A smaller brand pulling 3% is playing a very different game than a major brand posting to millions.
What Engagement Rate Benchmarks Should Media and Entertainment Brands Expect on Social Media?
Media and entertainment is crowded and split across platforms, so engagement benchmarks swing based on channel, subcategory, and even how each source calculates the metric. As with travel, personality-led posts and useful content tend to do well, but in this space, story quality matters more than posting volume. As a starting point, TikTok leads with engagement rates from 1.34% to 4.8%, while Facebook organic engagement lands much lower at 0.02% to 1.75%.
Platform | Engagement Range | Top-Performing Format |
|---|---|---|
TikTok | 1.34% – 4.8% | Narrative video |
0.30% – 3.7% | Carousels (3.2% avg.) | |
2.0% – 2.51% | Video (3.4% avg.) | |
0.02% – 1.75% | Albums (2.6% avg.) | |
X (Twitter) | 0.01% – 2.21% | Breaking news and live reactions |
YouTube | 0.21% median | Shorts / behind-the-scenes content |
One of the sharpest divides in this category is the gap between sports and general media. Sports teams beat general media publishers on almost every major platform. On Instagram, sports accounts average 1.30% engagement, while general media sits at 0.44%. On TikTok, sports teams hit 2.68% versus 1.34% for broader media brands. If you're not in sports, those bigger numbers are better seen as a high-water mark, not your starting line.
The bigger change here is simple: more content does not mean more engagement. Dash Social's 2026 Media and Entertainment Industry Benchmark Report puts it plainly:
"Results are driven by content quality and storytelling, not volume alone."
That lines up with the platform data. Media companies average 61.9 posts per week on Facebook and 49.9 on X. But the top Facebook engagement rate, 1.75%, is often tied to brands posting only twice a week. That's a useful reality check. Flooding the feed can keep your brand visible, sure, but it doesn't guarantee people will care.
The strongest examples make that point hard to ignore. The Dodo reached a 30.6% TikTok engagement rate through narrative animal storytelling, and Hulu drove 45 million YouTube views with behind-the-scenes footage and cast insights. Different audiences, different formats, same lesson: give people a reason to watch, react, and pass it along.
Another shift worth watching is the move from likes to shares. Instagram shares per reach grew by more than 150% in 2025. That's not a small change. A like can mean, "I saw this." A share usually means, "This is worth someone else's time." If your dashboard still leans on likes as the main signal, you're probably underrating the posts that carry the most audience value.
Treat all of these benchmarks as directional, not as vanity goals. They help set expectations, spot platform fit, and show where your content is underperforming - or where it's quietly doing better than you thought.
What Engagement Rate Benchmarks Should Nonprofit and Cause-Based Organizations Expect on Social Media?
Nonprofits often beat consumer brands on social media, especially on visual, mission-led channels. That edge comes from one simple thing: people have a reason to do something. When content ties the mission to a clear next step, engagement climbs. Instagram Reels stands out as one of the clearest wins in this space, and the numbers back it up. If you're trying to set sane social benchmarks for a nonprofit or cause-based group, the better question isn't just what gets seen - it's what gets people to act.
Nonprofits often post stronger engagement than consumer brands on visual, mission-led platforms.
Instagram Reels posts 4.0% engagement for nonprofits, making it the strongest format called out here for this category.
Call-to-action posts tend to beat passive awareness posts because they ask people to vote, sign, or share.
Per-follower and per-post engagement tell different stories, so teams should track both.
Nonprofits often do better than consumer brands on visual, mission-led platforms. That makes sense. Cause-based content gives people a direct reason to care, and on social media, that matters. People don't just want to scroll past a mission. They want to help, signal support, or pass the message along.
Instagram Reels is one of the clearest examples. In this category, nonprofits post 4.0% engagement on Instagram Reels, making it their strongest format here. If your team still treats Reels as optional, the data makes a strong case to change that.
The broader format picture looks like this:
Platform | Best Format | Avg. Engagement Rate |
|---|---|---|
Carousels | 5.5% | |
Reels | 4.0% | |
Photos | 3.4% | |
Albums | 3.0% | |
TikTok | Video | 1.3% – 7.5% |
X (Twitter) | Replies | 2.4% |
The pattern is pretty clear: ask for action, not passive attention. Posts that invite followers to vote, sign, or share tend to beat plain awareness content. A mission can move people, but a mission plus a direct ask moves them faster.
The June 2026 examples show how that plays out in practice. A single Canine Companions for Independence voting post drove 1,980 likes and 18 comments, while a Compassion in World Farming call-to-action post generated 1,160 reactions, 86 comments, and 307 shares. That's the difference between being seen and giving people something specific to do.
Measurement matters just as much as format. Track both per-follower engagement and per-post engagement. The first shows audience depth. The second shows reach. If you only watch one, you'll miss part of the story.
For nonprofits, per-follower engagement rates usually range from 1% to 5%, while per-post rates tend to fall to 0.03%–0.6%. That gap can surprise teams at first, but it shouldn't. A loyal base may react at a healthy rate, while total reach spreads performance across a much larger pool.
Channel roles matter too. Use TikTok for awareness and Facebook for conversion. TikTok is where attention tends to build. Facebook is where intent more often turns into action.
That same audience-intent split shows up again in higher education.
What Engagement Rate Benchmarks Should Higher Education Brands Expect on Social Media?
Higher education beats most industries on social media, and not by a small margin. Schools often outpace retail, beauty, and tech because their audiences are more invested: prospective students want a feel for campus life, current students want to see themselves reflected, alumni want to stay connected, and donors want proof of momentum. That mix matters just as much as the platform. A college or university isn’t speaking to one audience. It’s speaking to several at once, and that tends to lift engagement.
TikTok shows the biggest spread. Higher education posts reach a median engagement rate of 7.36% on TikTok, while the all-industry median sits at 2.01%. In plain terms, that’s a huge gap. Short, student-led TikToks tend to pull the strongest higher-ed engagement.
Here are the category benchmarks by channel:
Platform benchmarks:
Platform | Engagement Rate Range | Top Format | Top Format Rate |
|---|---|---|---|
TikTok | 2.3% – 7.36% | Video | 2.3% |
2.10% – 4.2% | Carousels | 5.4% | |
2.8% | Photos/Videos | 3.0% | |
0.13% – 2.2% | Albums | 5.2% | |
X (Twitter) | 0.04% – 2.4% | Status Updates | 2.4% |
Some themes punch above their weight across channels. Athletics, milestone moments, and campus aesthetics drive the strongest results. On TikTok, athletics content reaches a median engagement rate of 13.59%. Commencement and graduation content is close behind at 11.30%. Those numbers tell a pretty clear story: people respond when the content feels emotional, visible, and tied to school pride.
There’s another useful signal here for stretched marketing teams. Posting 15% less in 2024–2025 reduced total engagement by only 0.5%. That matters if your team is trying to do more with fewer people. More posts do not always mean more results. Better timing, better subject matter, and a better fit for each audience can carry more weight than raw volume.
Channel role matters too. TikTok and Instagram tend to reach students. Facebook tends to reach alumni and parents. LinkedIn tends to reach donors and faculty. X still plays a role for campus news and athletics. So when you read these benchmarks, start with who you need to reach, then look at the platform.
What Engagement Rate Benchmarks Should Financial Services Brands Expect on Social Media?
Financial services brands can earn solid social engagement, but they do it under tighter rules than most industries. In this space, audience intent is high, yet response is often slowed by compliance review, approvals, and long buying cycles. Financial services is a low-velocity, high-compliance category. Compliance, approvals, and long buying cycles shape both content and response. Instagram and LinkedIn tend to be the best channels for organic traction, while Facebook and TikTok often need paid support to reach scale.
Financial services brands should treat engagement benchmarks as directional markers, not fixed goals.
Instagram and LinkedIn tend to give the best organic results in this category.
Carousels on Instagram and photos or videos on LinkedIn often perform best for finance content.
TikTok can still play a role, but a paid-first approach often makes more sense than relying on organic reach alone.
Use one measurement method the same way every time; the table below uses average engagement per post.
Average engagement per post:
Platform | Avg. Engagement Rate | Best Format | Format Rate |
|---|---|---|---|
3.8% | Carousels | 4.1% | |
3.2% | Photos/Videos | 3.3% | |
X (Twitter) | 2.1% | N/A | N/A |
1.8% | Albums | 2.4% | |
TikTok | 1.6% | Videos | 1.58% |
Use the table as a directional benchmark, not a target.
Instagram also led weekly follower growth at 2.26%, while Facebook declined 0.61%. That split says a lot. If you're deciding where to put limited organic effort, Instagram is much more likely to return something useful.
Carousels are the standout format on Instagram, because they let brands break down complex financial topics across multiple frames. That matters in finance, where one post often has to explain a process, a market shift, or a rule change without losing people halfway through. Educational content, market insights, and regulatory updates fit this format well.
LinkedIn also stands out, especially for B2B financial services. In fact, two posts a week can beat posting more often, especially when compliance review slows production. That's a helpful reality check. More content doesn't always mean more results, and in a regulated field, slower output can still work if the material is useful and timed well.
TikTok's 1.6% average sits below the all-industry median of 2.01%. That doesn't mean brands should write it off. It just points to a different playbook. For many financial services brands, TikTok works better when paid media does the heavy lifting, instead of hoping organic reach will carry the channel.
The practical move is pretty simple: put organic focus on Instagram and LinkedIn, build around educational content, and check performance each month so you can spot movement early. These context rules matter even more in B2B, where approval cycles and buyer intent shape performance just as much as channel choice.
What Engagement Rate Benchmarks Should Professional Services and B2B Brands Expect on Social Media?
Professional services and B2B brands tend to see lower social engagement than consumer brands, but the stakes are often higher. A like, comment, or share in this space can point to buying interest, not just casual attention. LinkedIn stays the main channel here, with professional services brands posting average engagement rates of 2.15%–2.4%. For B2B teams, it makes more sense to judge performance by lead quality and platform fit than by raw interaction volume alone.
Company size shifts the benchmark on LinkedIn more than many teams expect. Small tech firms with 11–50 employees can reach 37.9% at the top decile, while firms with 1,000+ employees often sit closer to 15%. That gap matters. If you compare a smaller firm to a huge enterprise brand, you’ll get a skewed read on performance. The better move is to benchmark against companies in your own employee-size band. Business Services is a bit of an outlier: firms with 10,000+ employees can hit 25.5%, largely because proprietary research and sector intelligence tend to travel well.
Once company size is clear, content format becomes the next factor that can shift results.
Platform | Engagement Rate | Best Format | Notes |
|---|---|---|---|
2.15%–2.4% | PDF carousels, native video | Thought leadership, proprietary research | |
1.88% | Reels, carousels | Culture and behind-the-scenes | |
X (Twitter) | 1.6% | Real-time updates | Developer tools can spike to 3.89% |
1.5% | Industry news | Community groups | |
TikTok | 0.7%–3.0% | Founder stories, quick tips | B2B tech/SaaS |
LinkedIn PDF carousels stand out by a wide margin, with a 21.77% median engagement rate - the highest format rate across major platforms. Native video also beats standard posts. That tells you something useful: on LinkedIn, format choice isn’t a small tweak. It can change the whole result.
Employee advocacy can also shift the math fast. Employee posts drive 5–8x more reach than company-page posts, which makes them one of the strongest distribution levers in B2B. For teams in this space, the next move is simple: line up these benchmarks against your own audience mix and sales cycle.
How Do You Compare Your Brand's Engagement Rate Against Industry Benchmarks Fairly?
You can wreck a social readout with a bad comparison long before content performance even enters the picture. The most common problem is simple: brands pull their own engagement data one way, then line it up against a benchmark built with a different method. At that point, you're not comparing performance. You're comparing math. Use the same formula on both sides first. If the method changes, the meaning changes too.
The cleanest way to do that is to line up five things: formula, time period, audience scale, campaign type, and post format. If a benchmark was built from Q4 holiday traffic and your numbers come from Q1, the match is off from the start. The same goes for follower count. Compare your results against a benchmark built for your follower tier, not a much larger or smaller account base.
Platform differences matter too. TikTok often pushes content far past your follower base, so follower-based and reach-based rates are not interchangeable. A 2% TikTok engagement rate and a 2% Facebook engagement rate may look identical on paper, but they do not describe the same kind of performance.
Context also matters. An awareness post and a conversion post are doing different jobs, so they should not be graded on the same curve. And the formula you pick shapes what the metric is saying in the first place.
Formula | Use Case | Strength | Limitation |
|---|---|---|---|
ER by Reach (ERR) | Organic posts | Shows performance among people who actually saw the content | Reach swings and is hard to control |
Follower-based ER | Post-by-post comparison | Gives you a steady baseline over time | Misses viral reach beyond followers |
ER by Impressions | Paid/CPM campaigns | Shows paid spend efficiency | Repeat views are not the same as repeat engagement |
ER by Views | Video content (Reels, TikTok) | Ties engagement to video distribution | Repeat views can push the rate down |
For organic content, Engagement Rate by Reach (ERR) is the straightest formula because it measures response from the people who saw the post. For public benchmark comparisons, follower-based ER is still the default choice because reach data usually isn't public.
Once formula and audience size are aligned, look at the post's role in the funnel before you label it good or bad.
Benchmark Status | Funnel Stage | Content Type |
|---|---|---|
Above Benchmark | Upper Funnel | Viral short-form video, trending challenges, high-energy explainers |
At Benchmark | Mid Funnel | Educational content, community-driven posts, "day in the life" |
Below Benchmark | Lower Funnel | Product demos, conversion-focused CTAs, niche B2B procurement content |
That last row trips people up all the time. A product demo with a below-benchmark engagement rate is not automatically a miss. Lower-funnel content is built to drive action, not pile up likes. A 0.4% engagement rate can still do its job if it brings in qualified pipeline or high-value conversions.
So yes, benchmark your engagement rate. Just do it on equal terms. And don't stop there. Engagement is one signal, not the whole scoreboard. It sits next to reach, frequency, conversion rate, and incrementality when you're trying to judge social media ROI. Once the comparison is fair, the harder question is whether the benchmark is helping you see the truth or pulling you away from it.
What Are the Real Pros and Cons of Using Social Media Engagement Benchmarks?
Social media engagement benchmarks can help, but they can also send teams in the wrong direction. The difference comes down to how you use them.
Benchmarks add context. That part matters. But they only help when you line them up with the right goal, platform, and metric.
Used well, benchmarks work as reference points, not scorecards. They can speed up performance diagnosis, back up budget calls, and help teams set goals that make sense. They also make it easier to compare platform performance across categories that play by different engagement rules. For example, LinkedIn's year-over-year growth can help B2B teams decide where to put more effort.
The trouble starts when teams treat benchmarks like fixed grades. They also fall apart when the denominator changes. In Financial Services on Instagram, one source reported 0.26% engagement while another reported 3.80% for the same period. That's a 14x gap, caused entirely by the formula used. That kind of swing can change the whole story. On top of that, many benchmark reports rely on small or uneven samples, so category averages can hide huge differences tied to brand size. Then there are platform shifts. TikTok's engagement rate fell 8% year-over-year as the platform matured and ad load went up. So if you're leaning on a benchmark from 18 months ago, you may already be working off old news.
The table below shows where benchmarks help most and where they tend to break.
Use Case | Pros | Cons | Best Interpreted With |
|---|---|---|---|
Executive Reporting | Provides context for KPIs and supports budget decisions | Can pull attention toward surface metrics | Conversion rate and ROAS |
Campaign Planning | Sets realistic reach and interaction targets | Industry definitions vary between studies | Historical internal data |
Platform Strategy | Helps identify where audience interaction is strongest | Algorithm shifts can make data outdated quickly | Audience growth rate |
Performance Diagnosis | Quickly spots underperforming content | Spikes may reflect crises rather than meaningful engagement | Sentiment analysis and comment quality |
Influencer Vetting | Helps filter partners using industry norms | Small samples and fake engagement can distort averages | Save-to-like ratio and comment quality |
The biggest mistake? Acting like every post has the same job.
Some posts are built for comments. Some are built for clicks. Some are there to drive leads or sales. A low engagement rate is not automatically bad if the content is doing what it was meant to do. As SocialRails puts it:
"A 1% engagement rate that drives qualified leads is better than 5% engagement from unqualified audiences. Use benchmarks as guides but measure success through revenue, leads, and customer acquisition metrics."
That's the point in plain English: the benchmark tells you where to look, not what to think.
If your CTR, add-to-cart rate, lead quality, or ROAS beat category norms, then a below-benchmark engagement rate is not a warning sign. It may simply mean the content is doing a better job filtering for buyers instead of casual scrollers. Numbers can start the diagnosis. Business results finish it.
What Do Social Media Engagement Benchmarks Actually Tell You Across Industries?
Short-form video tends to win on engagement across industries, but that headline can mislead you fast if you ignore category and calculation method. A nonprofit, a university, and a B2B SaaS brand do not play by the same rules. Some audiences are far more likely to comment, share, and save content from the start. Others are more selective and act later in the funnel. That’s why a benchmark only helps when you compare your results against the right industry group and the right formula.
Emotion-led, community-driven industries usually outperform transactional categories because their content is easier to share, save, and comment on. High-intent, community-led categories - higher education, nonprofits, food and beverage, and media and entertainment - benefit from audiences that are already motivated to react. Transactional and regulatory categories face a different dynamic from the start.
Think about it this way: a college acceptance story or a nonprofit mission clip invites an instant response. A financial services explainer or enterprise software update often does not. That gap does not mean one brand is doing better marketing. It means the audience behavior is different, and the benchmark has to reflect that.
Transactional categories such as financial services, B2B SaaS, and technology should weigh engagement quality, lead quality, and conversion more heavily than raw likes. That does not mean failure; it means raw engagement is the wrong primary metric. In these sectors, a smaller number of saves, clicks, demo requests, or qualified leads can matter more than a spike in reactions.
So yes, context matters more than the raw number alone. Always read benchmarks by source and formula first; the same industry can look very different depending on whether the rate is based on followers, reach, or impressions. That one detail can swing the story in a big way. Once the method is clear, the benchmark becomes a useful readout instead of a misleading headline.
The real value of benchmarks is not the number itself, but the context it gives your own performance. Use benchmarks to frame performance, then validate them with conversion and revenue data.

AI SEO & GEO
Jun 20, 2026
Answer Engine Optimization makes AI citations the new visibility battleground—formats, prompts, and off-site signals decide that brands get seen and drive demand.