Walmart ad metrics can look strong while spend still leaks. A campaign may post solid ROAS, pull clicks, and still miss sales volume, margin, or new-customer growth. That is the problem most teams face: too many numbers, not enough clear budget calls. This guide breaks down the KPI patterns that matter most, so teams can read Walmart Connect data with less guesswork and make better spend decisions across search, product, and retail media campaigns.
TL;DR
Walmart ad metrics work best when they are read in groups, not one by one.
Visibility, engagement, cost, and sales each answer a different budget question.
High CTR with weak CVR usually points to a product page issue, not a bid issue.
ROAS alone is not enough if sales volume, margin, or new-to-brand rate stay weak.
The best spend moves come from pattern reading, not dashboard watching.
How to Read Walmart Ad Metrics Without Missing the Full Picture
Walmart ad metrics make it easy to stare at one number and miss what’s happening underneath. The right read comes from four layers: visibility, engagement, efficiency, and outcome. Each layer answers a different question. Together, they show whether bids should go up, waste should be cut, or budget should move to better-performing campaigns.
Visibility metrics
Visibility metrics (impressions and impression share) show whether ads are winning enough placements. When visibility is low, the campaign is not competing in the spots that matter.
Engagement metrics
Engagement metrics (clicks and click-through rate (CTR)) show whether the ad gets shoppers to click after it appears. A low CTR on a high-impression campaign points to a relevance gap: the ad is getting served, but shoppers are not engaging with it. After engagement is clear, CPC and ROAS help show whether that traffic is worth the spend.
Efficiency metrics
Efficiency metrics (cost per click (CPC) and return on ad spend (ROAS)) show whether traffic and revenue are coming in at a cost the business can accept.
Outcome metrics
Outcome metrics (conversion rate (CVR), attributed orders, units sold, sales revenue, and new-to-brand metrics) tie ad activity straight to business results. These are the clearest signals for whether spend is driving revenue and growth.
Daily, weekly, and monthly review cadence
The table below shows when to check each KPI:
Review Cadence | Metrics to Check | Primary Purpose |
|---|---|---|
Daily | Impressions, Impression Share, CPC, Ad Spend | Pacing control and bid adjustments |
Weekly | Clicks, CTR, CVR, Attributed Orders | Ad relevance and conversion health |
Monthly | ROAS, Sales Revenue, Units Sold, New-to-Brand | Budget allocation and scaling decisions |
Use daily checks for pacing, weekly checks for relevance and conversion, and monthly checks for scaling. With the review cadence in place, the next sections define each KPI.
1. Impressions
What the metric measures
Impressions track how many times an ad appears in front of shoppers. It’s the first metric to check when judging scale. From there, clicks and CTR help show whether that reach is turning into engagement.
When teams should watch it
Impressions deserve a daily check during product launches, bid updates, and seasonal campaigns. After that, impression volume should be compared with impression share to tell whether weak reach comes from soft demand or from limited access in the auction.
Budget or bid decision it informs
Impressions help spot scale limits fast. This metric matters most when the goal is to decide between expanding reach and fixing relevance.
Impression Trend | Performance Context | Recommended Action |
|---|---|---|
Low impressions | High CVR / High ROAS | Increase bids and expand keyword targeting to scale |
High impressions | Low CTR / Low CVR | Refresh creative assets; check audience or keyword relevance |
Rising impressions | Stable ROAS | Maintain or slightly increase budget to capture momentum |
Best reporting use case
Raw impressions show exposure, but they do not show how much demand was left on the table. Impressions show scale. Impression share shows how much of that available scale was captured. That is covered under impression share below.
2. Clicks
Clicks come right after impressions, and that matters. Impressions show reach. Clicks show whether that reach earned attention. In Walmart advertising, clicks signal interest, not value. A shopper saw the ad and chose to act. That makes clicks a practical way to judge whether media spend is driving traffic worth paying for or just stacking up empty exposure.
What the metric measures
A click means the ad felt relevant enough to spark action. The shopper moved from passive exposure to active interest. That does not mean the shopper will buy, but it does mean the ad cleared an early hurdle.
Clicks work best as a spend-diagnosis signal. They help teams sort out wasted reach from traffic with a real chance to convert. If impressions are high but clicks stay weak, the problem often sits with keyword fit, bid pressure, or ad content. If clicks rise, the ad is doing its job at the attention stage.
When teams should watch it
Teams should watch click volume right after changes to bids, keywords, or creative. That is when the signal is most useful. A jump in clicks after an update usually shows stronger engagement. A drop can mean the change hurt relevance or visibility.
Click volume also helps confirm shopper intent trends. If more shoppers are clicking, the ad is connecting better with the audience being reached. If fewer shoppers are clicking, the campaign may be pulling in low-fit impressions or losing ground in the auction.
Budget or bid decision it informs
Strong clicks paired with weak sales usually point to friction after the click. In plain terms, the ad got the shopper interested, but the product page did not finish the job. That is the moment to audit the listing, especially:
Images
Copy
Ratings
Reviews
If clicks are rising and sales are strong, budget expansion makes sense because the ad and listing are working together. If clicks are flat or falling, teams should review bid levels, keyword relevance, and creative before adding spend.
Click Signal | Sales Context | Recommended Action |
|---|---|---|
Rising clicks | Strong sales | Scale budget; the ad and listing are aligned |
Rising clicks | Weak sales | Audit the product detail page for images, copy, and reviews |
Flat or falling clicks | Any | Review bid levels, keyword relevance, and creative |
Best reporting use case
Clicks are most useful as a diagnostic layer between impressions and sales. They help answer a simple but high-stakes question: is the campaign struggling to earn engagement, or is it struggling to convert the traffic it already gets?
That distinction makes the next budget or bid call much easier. Low clicks suggest an attention problem. Decent clicks with weak sales suggest a conversion problem. Without that middle signal, teams can end up changing bids when the real issue sits on the product detail page.
CTR shows how efficiently impressions turn into clicks.
3. Click-Through Rate (CTR)
Clicks show volume. CTR shows efficiency. Click-through rate (CTR) measures the share of impressions that turn into clicks. It is calculated by dividing clicks by impressions and expressing the result as a percentage. In plain terms, CTR shows how well an ad earns the click and how well impressions convert into traffic.
What the metric measures
CTR reflects whether the creative, keyword targeting, and bid strategy match what shoppers want to see at that point in the buying journey. If that match is strong, shoppers click. If it is off, impressions pile up without much response.
When teams should watch it
CTR deserves close attention in two moments: during creative testing cycles and in the early days of a campaign launch. In A/B tests, CTR is often the fastest signal available. It helps teams judge which hook, image, or headline lands first, well before sales data has enough volume to guide a call.
A steady drop in CTR is also a warning sign of ad fatigue. The message has likely lost its pull, and the creative needs to be updated before performance slips further.
Budget or bid decision it informs
CTR helps answer a simple question: is the issue attention, or is it relevance? High impressions with low CTR usually point to a problem with the creative or the match between the ad and the audience. In that case, the best move is to test one variable at a time, starting with the image or headline, before putting more spend behind the campaign.
When CTR is strong but conversion rate is weak, the ad is doing its job. The drop-off is happening after the click. That gap often points to pricing, product details, or landing page relevance.
CTR Signal | Conversion Context | Recommended Action |
|---|---|---|
Low CTR | Any | Test one variable at a time, image or headline first |
High CTR | Weak CVR | Audit pricing, product details, and landing page relevance |
High CTR | Strong CVR | The full funnel is working |
Declining CTR over time | Any | Refresh creative assets to address ad fatigue |
Best reporting use case
CTR works best as an early-warning diagnostic between impressions and later outcomes. It answers one direct question: is the campaign failing to earn attention, or is it earning attention and losing shoppers somewhere else?
That distinction matters because it changes the next move. Teams should keep the focus on actions that affect spend decisions: refresh creative, test one element, audit the product detail page, or hold steady because the full funnel is working. From there, the analysis moves to click cost.
CPC shows what those clicks cost.
4. Cost Per Click (CPC)
Once CTR shows whether shoppers are clicking, CPC shows what those clicks cost. Cost per click, or CPC, measures the price paid for each click on a Walmart Connect Sponsored Search or Sponsored Products ad. On its own, CPC gives only part of the picture. It becomes far more useful when matched with CVR and ROAS.
What the metric measures
CPC shows how much a brand pays to bring in each click. That sounds simple, but the bigger issue is whether that click leads to a sale or some other target outcome. Cheap traffic is not always good traffic, and high-priced traffic is not always bad. The key is what happens after the click.
When teams should watch it
CPC needs close attention when bids change. It also matters during seasonal promotions and budget pacing checks. In pacing reviews, CPC can flag a growing cost problem before spend gets out of hand. When the cost of getting a click climbs faster than attributed sales revenue, that points to waste. In that case, teams should lower bids or refresh ad creative and listing content to help lift CTR and CVR.
Budget or bid decision it informs
CPC works best as a cost filter before a team changes bids or scales spend. It is most useful when paired with conversion rate and ROAS, since those metrics show whether the click price is worth paying. The combinations below make that tradeoff easier to read:
CPC + CVR Combination | Diagnosis | Recommended Action |
|---|---|---|
High CPC / High CVR | Traffic is expensive but worth paying for | Maintain bids or scale if ROAS stays strong |
High CPC / Low CVR | Spend is too high for weak results | Lower bids or improve listing quality |
Low CPC / Low CVR | Clicks are cheap, but shopper intent is weak | Shift budget to keywords with stronger buying intent |
If CPC looks acceptable but sales still lag, the next metric to check is CVR.
5. Conversion Rate (CVR)
After CTR and CPC show traffic quality and click cost, conversion rate (CVR) shows whether that traffic turns into sales. CVR measures the share of clicks that become attributed orders on Walmart. The formula is simple: attributed orders divided by total clicks.
What the metric measures
CVR answers a plain business question: are the right shoppers landing on the right product page? For consumer brands, average conversion rates often sit roughly between 1.5% and 2.5%, while top performers land closer to 4% to 6%. That difference matters. A small lift in CVR can mean more orders from the same traffic, which changes the math on ad spend fast.
When teams should watch it
CVR deserves a weekly check, but it needs close attention when CTR looks solid and attributed orders stay flat. That pattern usually signals a problem after the click. Shoppers are showing interest, but something on the listing is slowing them down.
Common friction points include poor images, thin product descriptions, and too few verified reviews. In plain terms, the ad may be doing its job, while the product page is not.
Budget or bid decision it informs
Teams should not scale spend until the product page is in good shape. CVR should guide that call. Before budgets or bids go up, the listing needs strong visuals, detailed copy, and verified reviews that help shoppers feel ready to buy.
A+ content can make a major difference here. Better listing pages can lift conversion rate meaningfully, and that lift changes whether added spend is likely to pay off or just bring in more wasted clicks.
When CVR is healthy, Sales Revenue becomes the next metric to watch because it shows whether those conversions are turning into meaningful growth.
6. Sales Revenue
Sales revenue in Walmart Connect tracks the gross dollar value of purchases tied to ads across Walmart.com, the Walmart app, and physical stores. It shows gross attributed sales, not profit.
What the metric measures
Sales revenue answers a simple question: How many dollars did the campaign help drive? That makes it useful for judging direct ad impact and retail movement. But it does not show what the business kept after costs.
Gross revenue is not profit. Sales revenue shows the total dollar value linked to ad activity, while contribution margin shows what remains after subtracting COGS, shipping, and marketing costs. Use revenue to gauge growth. Use contribution margin to check whether that growth should be scaled.
Metric | What It Measures | Best For |
|---|---|---|
Sales Revenue | Total attributed dollar value of sales (gross) | Measuring direct campaign impact and retail velocity |
Contribution Margin | Revenue minus COGS, shipping, and marketing costs | Ensuring actual profitability of ad spend |
When teams should watch it
Watch sales revenue closely when ROAS looks strong but revenue stays flat. That gap often means the campaign is working well inside a small pocket of demand, yet it is not adding much business volume.
In plain terms, the ads may be efficient, but they may not be reaching enough shoppers to matter at scale.
Budget or bid decision it informs
When sales revenue and ROAS both move up while impression share remains low, that usually points to room for growth. In that case, increasing budget can help capture more of the traffic that is already available.
If revenue goes up but contribution margin gets thinner, hold spend where it is. More sales are not enough on their own if costs are eating away the return.
Revenue shows scale. ROAS shows whether that scale was efficient.
7. Return on Ad Spend (ROAS)
Return on Ad Spend (ROAS) shows how much attributed sales a campaign brings in for every $1.00 spent. A ROAS of 4.0 means $4.00 in attributed sales for each $1.00 put into media. That makes ROAS the main gut check before adding more budget. It shows whether revenue output is strong enough to support more spend.
What the metric measures
ROAS tracks how well ad spend turns into revenue. It is a revenue metric, not a profit metric, so it should never stand alone for low-margin products. A campaign can post a strong ROAS and still put pressure on margin if costs are too high elsewhere.
When teams should watch it
ROAS is often the clearest signal for whether a campaign should scale or stay put. If ROAS is strong but impression share is low, that usually means the campaign is working but not reaching enough shoppers yet. In that case, a careful budget increase may make sense. For new-to-brand campaigns, a lower ROAS can still work when customer lifetime value supports the spend.
Budget or bid decision it informs
When ROAS is healthy and impression share still has room to grow, budgets can move up in small steps. A common rule of thumb is to raise daily budgets by no more than about 20% at a time so the campaign can stay steady while the system adjusts. Big jumps often look tempting, but they can throw off pacing and make performance less steady.
If ROAS looks strong on the surface but contribution margin is getting squeezed, holding spend is often the better call than scaling. Revenue without enough margin is a shaky win.
Blended ROAS also matters here. Total revenue divided by total spend across active channels gives a cleaner view of return when channels overlap. Without that blended view, channel-level ROAS can make results look better than they are.
After ROAS, ad spend shows what it takes to buy that efficiency.
8. Ad Spend
Ad spend is the total dollar amount put into Walmart media. ROAS tells teams what came back. Ad spend shows what it took to get there.
What the metric measures
Ad spend is a cost input, not a performance result. On its own, the number does not say much. Its meaning comes from the gap between spend and sales.
When teams should watch it
Teams should track ad spend every day for pacing and bid control. Then they should review it each week and month against sales to spot drift, waste, or overdelivery.
Budget or bid decision it informs
Spend is the lever. Attributed orders and sales are the outcomes under review. If spend climbs faster than orders or sales, the campaign is likely running into diminishing returns. Budget analysis helps show where extra dollars stop adding revenue, so teams can move budget to campaigns that are doing more work.
A simple guardrail helps here: after a major budget shift, give the campaign several days to settle before judging results.
The next step is to check attributed orders and confirm whether spend is turning into transactions.
9. Attributed Orders
Attributed orders show whether Walmart ad spend is turning clicks into purchases. The metric ties a completed transaction to an ad interaction, which makes it one of the clearest ways to see if paid media is driving orders instead of just traffic.
What the metric measures
Attributed orders track the number of purchases connected to an ad interaction. Put simply, they show how many transactions paid media generated.
This metric works best when paired with two other numbers: units sold and sales revenue. Attributed orders show transaction count, units sold show item volume, and sales revenue shows dollar output. That split matters. A campaign can drive many orders but few items per order, or fewer orders with larger baskets.
When teams should watch it
Teams should review attributed orders every week to check whether paid traffic is producing purchases. Weekly review helps spot movement early without reacting to daily noise.
Budget or bid decision it informs
High attributed orders paired with weak ROAS often point to low-margin volume. In that case, the next step is to review product mix before adding more budget. More orders sound good on paper, but if those orders come from lower-value items, profit can slip.
Strong ROAS with a low order count usually points in the other direction. The campaign may be efficient but underfunded, which means it can often handle more budget.
Attributed orders should also be read alongside units sold. That side-by-side view helps separate transaction count from basket size, which keeps teams from mistaking more orders for larger baskets.
10. Units Sold
Attributed orders tell teams how many purchases an ad influenced. Units Sold shows how many items those purchases included. That difference matters. A shopper might place one order with three products, which means one attributed order but three units sold. In Walmart ad reporting, Units Sold counts individual items purchased after an ad interaction, not the number of transactions. For CPG brands, that makes it a spending signal as much as a sales metric, because it shows whether media dollars are moving more product instead of just adding order count.
What the metric measures
Units Sold tracks item volume tied to ad spend. It answers a simple question: How much product did the campaign move? That view becomes more useful when paired with sales revenue. If unit volume is high but revenue stays soft, lower-priced SKUs or heavily discounted items may be doing most of the work. That can look good on volume at first glance while putting pressure on margin and average order value.
When teams should watch it
Units Sold deserves close review during promotional windows, seasonal spikes, and new product launches. Those are the moments when purchase behavior can shift fast. During a promotion, for example, shoppers may load up on discounted items, pushing unit volume up faster than revenue. During a launch, early demand may show up first in item count before the full revenue picture settles out. In both cases, Units Sold helps teams check whether campaigns are driving product movement at the pace expected.
Budget or bid decision it informs
When spend rises but unit volume stays flat, the signal is hard to ignore: cost per unit is climbing, and returns are starting to weaken. That usually calls for a closer look at bids, ad creative, and purchase friction on the product page. On the other hand, when spend and unit volume move up together, the campaign may be scaling well, though stock levels still need attention.
Metric Relationship | Signal | Recommended Action |
|---|---|---|
Spend ↑ / Units Sold flat | Rising cost per unit | Lower bids; test new creative; check purchase friction |
Spend ↑ / Units Sold ↑ | Healthy scaling | Maintain or raise budget; watch stockouts |
Spend flat / Units Sold ↓ | Inventory or competition issue | Check stock levels; review competitor pricing/promotions |
Spend ↓ / Units Sold ↑ | Strong organic momentum | Hold low bids; redirect budget to underperforming SKUs |
Best reporting use case
Use Units Sold with sales revenue to see whether campaign volume is coming from lower-priced or discounted SKUs. Together, those two metrics show whether ad spend is driving volume, dollar value, or both. That distinction matters when teams need to decide whether a campaign is helping the business grow or just pushing more low-margin product.
If Units Sold shows how much product the campaign moved, Impression Share shows how much available demand it captured.
11. Impression Share
Impression share shows how much of the available ad visibility a campaign is actually winning. When impression share is low, a brand may be missing eligible traffic because the budget is too tight or bids are not strong enough. If unit sales look solid but growth starts to stall, impression share can reveal whether the campaign has simply run out of room to reach more shoppers.
What the metric measures
Impression share is a visibility metric. It answers a simple question: Of all the times shoppers were eligible to see this ad, how often did they actually see it?
When teams should watch it
This metric matters most when ROAS and CVR are both healthy, but sales volume has leveled off. That pattern usually means the campaign is doing its job inside the audience it already reaches, but it is not reaching enough of the market to add more total revenue. It also becomes more important during major Walmart promo windows, when shopper demand jumps and ad competition gets tighter.
Teams should keep an eye on impression share when spend is going up as well. A bigger budget does not always lead to a matching lift in reach. If impression share stays flat or starts to fall while spend climbs, the campaign may be running into diminishing returns. That usually points to issues with bids, targeting, or creative before more dollars are added.
Budget or bid decision it informs
Impression share works best as a scale signal, not just a visibility score. It helps teams decide whether the next move should be a budget increase, a bid change, or a deeper account review.
Impression Share | Performance Context | Recommended Action |
|---|---|---|
Low | High ROAS / High CVR | Increase daily budget and bids to scale |
High | Low ROAS / Low CVR | Lower bids or refresh creative |
Low | Low ROAS | Audit keywords and creative |
When impression share is low because the campaign runs out of budget before the day is over, increasing the daily cap is often the fastest fix. When low impression share comes from weak bid strength, increasing bids on high-intent keywords is the more precise move.
Best reporting use case
Use impression share to spot campaigns that can take on more budget without giving up efficiency. It helps teams decide when to raise bids, increase budget, or shift spend when growth is limited by reach.
12. New-to-Brand Metrics
The last KPI layer moves past efficiency and looks at customer acquisition.
What the metric measures
New-to-brand (NTB) metrics show whether a purchase came from a first-time Walmart buyer: someone who hasn't bought from the brand on Walmart in the past 12 months. ROAS measures efficiency. NTB shows whether that return is coming from new buyers or repeat buyers. A campaign can post strong ROAS and still rely mostly on repeat demand.
When attributed orders are high but NTB rates stay low, that usually points to heavy reliance on branded search terms. In plain terms, the campaign is pulling in shoppers who already know the brand instead of bringing in new ones. That’s why NTB matters when efficiency by itself doesn’t tell the full story.
When teams should watch it
NTB should be the lead KPI for product launches and category expansion. If NTB is low at launch, spend is often tilted too far toward branded keywords and not far enough toward category terms.
Teams should also watch NTB when attributed orders look strong but NTB remains weak. That mix often means the campaign is running well inside a fixed audience, not growing beyond it.
Budget or bid decision it informs
NTB helps reset ROAS targets by campaign type. Read NTB next to ROAS to decide whether a campaign should scale, hold, or shift keyword focus.
If NTB is strong, conquesting campaigns may deserve lower ROAS thresholds. That gives the brand room to keep spend in market, support trial, and build repeat purchase over time.
Campaign Signal | Signal | Action |
|---|---|---|
High ROAS / Low NTB | Reaching existing loyalists | Shift budget toward category keywords |
Low ROAS / High NTB | Acquiring new customers | Hold or increase budget; lower ROAS threshold |
High ROAS / High NTB | Efficient acquisition | Maintain or increase budget |
Best reporting use case
Use NTB metrics to judge whether a campaign is building long-term growth or simply defending the current customer base.
Quick-Reference Decision Guide by Metric
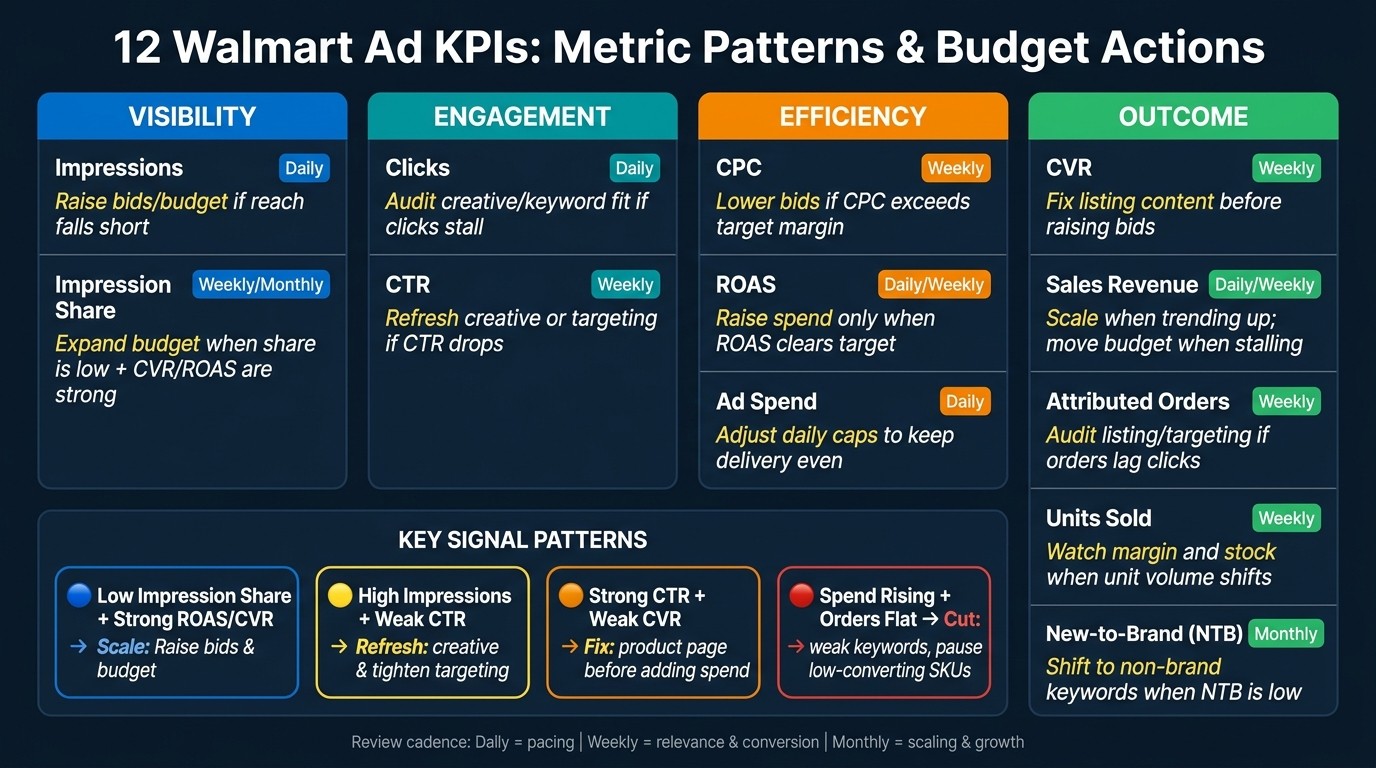
Once the KPI definitions are clear, this table helps turn each signal into a budget call instead of leaving it as a dashboard number.
Metric | Signal | Cadence | Action |
|---|---|---|---|
Impressions | Ad reach | Daily | Raise bids or budget if reach falls short of goals |
Clicks | Shopper engagement | Daily | Audit creative, keyword fit, or placement if clicks stall after changes |
CTR | Attention efficiency | Weekly | Refresh creative or targeting if CTR drops from the recent baseline |
CPC | Bid pressure and click cost | Weekly | Lower bids if CPC moves past the target margin; raise bids if impression share is slipping |
CVR | Post-click conversion | Weekly | Fix listing content before raising bids |
Sales Revenue | Gross attributed revenue | Daily/Weekly | Scale spend when revenue trends up; move budget when revenue stalls |
ROAS | Revenue per $1 of spend | Daily/Weekly | Raise spend only when ROAS clears the target; hold or cut if it falls below |
Ad Spend | Budget pacing | Daily | Adjust daily caps to keep delivery even across the full month |
Attributed Orders | Purchase volume from ads | Weekly | Audit listing and targeting if orders lag behind clicks and spend |
Units Sold | Product volume moved | Weekly | Watch margin and stock when unit volume shifts |
Impression Share | Share of eligible impressions won | Weekly/Monthly | Expand budget or bids when share is low and CVR and ROAS are already strong |
New-to-Brand (NTB) | Whether sales come from new customers | Launch and monthly | Shift toward non-brand keywords when NTB is low; accept a lower ROAS target when NTB is high |
The next step is to read KPI combinations together, not in isolation.
How Do You Turn Walmart Ad Metric Patterns Into Actual Budget Decisions?
Use metric combinations to decide where to raise bids, cut waste, or shift budget. The goal is simple: turn KPI movement into a clear budget action instead of reacting to one number in isolation. Start with the strongest signal in each pair, then make one change at a time so the next result is easier to read.
Low Impression Share With Strong CVR and ROAS
This is a clear scale signal. The campaign is converting well and producing strong return, but it is not showing often enough to capture all available demand. In plain terms, Walmart shoppers are responding when the ad appears, yet reach is being capped.
The budget move here is straightforward: raise bids and increase daily budgets. That opens more auction coverage and gives top-performing products more room to win traffic. If budget is tight, shift spend from weak SKUs or weak keyword groups into these high-efficiency campaigns first.
Healthy Impressions With Weak CTR
The ad is getting served, but shoppers are not clicking. That usually points to a message problem, a targeting issue, or both. More spend alone will not fix it. It will just buy more ignored impressions.
The right move is to refresh creative and tighten targeting. Test new headlines, swap in stronger images, and check whether the targeting is too broad or mismatched to shopper intent. Budget should stay controlled until click-through rate improves, because low CTR often signals wasted exposure.
Strong CTR With Weak CVR
This pattern means the ad is doing its job up front. It is winning attention and driving traffic. The drop happens after the click, which usually shifts the problem away from media and toward the product detail page.
Before adding budget, fix the product page: price, images, copy, and reviews. If shoppers click but do not buy, the listing may be losing trust or failing to answer basic purchase questions. Pushing more spend into that gap can drive more traffic without adding enough orders to justify the cost.
Spend Rising Faster Than Attributed Orders or Sales
This is a waste-control signal. Spend is moving up, but attributed orders or sales are not keeping pace. Left alone, this pattern can erode efficiency fast.
The budget action is to cut bids on weak keywords, tighten targeting, and pause low-converting SKUs before reallocating budget. That sequence matters. Pull spend out of underperforming areas first, then move it into campaigns, products, or search terms that already show better order volume or sales efficiency. This keeps budget shifts tied to proof instead of guesswork.
Cross-Network Reporting for Budget Allocation
Brands running Walmart alongside other retail media channels need one reporting view to compare performance on equal terms. Without that, budget decisions can get distorted by mixed attribution windows, mismatched KPI definitions, or channel-by-channel blind spots.
Use a shared reporting setup to compare results across networks and align attribution windows before making budget allocation decisions. A campaign can look strong on one platform and weak on another simply because each network counts sales differently. Clean comparison is what makes budget shifts rational instead of reactive.
What Is the Main Takeaway From Tracking These 12 Walmart Ad Metrics Together?
The 12 Walmart ad metrics matter most when they are tracked as one connected system: visibility, engagement, efficiency, and outcome.
From there, each metric falls into four decision layers. Visibility metrics show reach. Engagement metrics show attention. Efficiency metrics show cost. Outcome metrics show revenue and customer growth.
Closed-loop attribution makes it possible to judge ad spend across online and in-store sales, not clicks alone.
That shift is what turns reporting into budget decisions.
If your Walmart dashboards are full of numbers but short on clear budget calls, talk to Bigeye. Our retail media team reads Walmart Connect data alongside your other networks and turns the patterns into bid and budget moves.
FAQs
What are the most important Walmart ad metrics to watch first?
The first group to watch is usually impressions, CTR, CPC, CVR, and ROAS. Together, they show reach, attention, click cost, conversion, and return.
Is ROAS the main KPI for Walmart Connect campaigns?
ROAS is one of the top KPIs, but it should not stand alone. Sales revenue, units sold, contribution margin, and new-to-brand rate help show whether the return is large enough and worth scaling.
What does low impression share mean in Walmart ads?
Low impression share usually means the campaign is missing eligible visibility. That can happen because the budget is too tight, bids are too low, or targeting is not strong enough to win enough placements.
Why do clicks go up while sales stay flat?
That pattern often points to a post-click issue. The ad may be earning interest, but the product page may be weak on price, images, copy, ratings, or reviews, requiring you to optimize your website experience for conversions.
How often should Walmart ad metrics be reviewed?
Daily checks work best for pacing and cost. Weekly reviews suit clicks, CTR, CVR, and orders. Monthly reviews suit ROAS, revenue, units sold, and new-to-brand trends. If you'd rather not run that cadence in-house, talk to Bigeye.
Related from Bigeye
Case study: Florida Crystals
Podcast: Demystifying Marketing Efficiency Ratio with Adam Ortman

CPG Marketing
Oct 4, 2026
A CPG marketing strategy for 2027 in eight steps, with Bigeye shopper research and current data on private label, retail media, creators and AI search.