
Understanding influencer engagement metrics is one of the most reliable ways to measure how well your social media content connects with your audience. Here's what you need to know about 2026 benchmarks across key platforms:
TikTok: Leads with a median engagement rate of 4.25%, driven by its algorithm and shareable short videos. Nano-influencers perform best at 7.84%.
Instagram: Median engagement rate is 0.48%, though nano-accounts reach 3.42%–4.84%. Reels outperform static posts with 1.23%–1.48% engagement.
Facebook: Pages struggle with 0.15%, but Groups thrive, reaching 40%–50% of members per post.
LinkedIn: Engagement is growing, with a median of 2.1%. Personal profiles outperform company pages significantly.
X (Twitter): Median engagement rate is 1.11%, with threads and native images performing better than single tweets.
Key Takeaways:
Engagement rates vary by platform, industry, and account size.
TikTok and Instagram dominate for consumer reach, while LinkedIn excels in professional networking.
Content format matters - videos, carousels, and interactive posts perform better across most platforms.
Each platform has its strengths and weaknesses. Choose the one that aligns with your audience and goals.
2026 Social Media Engagement Rates by Platform Comparison
1. Instagram
Engagement Rate Benchmarks
In 2026, Instagram's median engagement rate stands at 0.48%, calculated as interactions divided by follower count. However, this figure can vary greatly depending on how engagement is measured. For example, studies analyzing engagement per individual post report rates as high as 1.81%. This highlights how methodology can significantly influence reported rates.
The size of an account also plays a huge role. Nano-accounts (1,000 to 10,000 followers) enjoy engagement rates ranging from 3.42% to 4.84%, while mega-accounts (over 500,000 followers) see much lower rates, between 0.76% and 0.81%. On average, an Instagram post garners 335 likes, 20 comments, and 45 shares. Interestingly, public engagement patterns are evolving - comments have dropped 16% year-over-year as Instagram's algorithm increasingly rewards saves and shares over likes.
"Instagram likes are declining not because content is weaker, but because the platform prioritizes watch time, saves, and shares over passive engagement." - Valeria Sillani, Global Social Media Manager, EasyVista
Industry-Specific Performance
Engagement rates differ widely across industries. Education consistently leads the pack with rates between 2.10% and 3.26%. On the other hand, financial services struggle, landing between 0.20% and 1.12%. Food and beverage brands perform well, achieving rates of 1.60% to 2.20%, while retail and e-commerce settle at 1.20% to 1.45%. Meanwhile, tech and SaaS companies face challenges, averaging only 0.30% to 0.94%.
Content Types Driving Engagement
When it comes to content formats, carousels continue to lead with a 0.55% engagement rate. One reason for their success is their "double exposure" effect - they appear twice in users' feeds, which naturally boosts views and interactions.
Reels, on the other hand, average engagement rates of 1.23% to 1.48% and generate 36% more reach compared to carousels. They’re a powerful tool for discovery. However, carousels excel in another area: they generate 2 to 3 times more saves than any other format, which is a key factor in Instagram's algorithm. In contrast, static images have seen a decline, with engagement rates dropping to just 0.37%, a 17% year-over-year decrease.
"A 'save-worthy' carousel comes down to one factor: service content. These are the posts that share a piece of helpful information that a fan will want to come back to reference later." - Kyle Mccall, Social Media Manager
Next, let’s take a closer look at Facebook engagement benchmarks to explore how platforms differ.
2. Facebook
After diving into Instagram's dynamics, Facebook reveals a different story, shaped by its strong community focus.
Engagement Rate Benchmarks
As of 2026, Facebook's median engagement rate sits at 0.15%, calculated by dividing interactions by follower count. Average engagement per post, however, falls between 1.30% and 2.20%. Organic reach for Facebook Pages has seen a decline, with posts typically reaching just 1.4% to 2.5% of their followers. On the other hand, Facebook Groups shine with much stronger performance, reaching 40% to 50% of their members per post and generating two to five times more engagement than standard Page posts.
Interestingly, the average number of likes per post climbed by 64% year-over-year, reaching 255 in early 2026. Comments and shares also grew, averaging 22 and 17 per post, respectively.
"Facebook's like rebound shows what happens when brands stop treating every platform the same and remember that Facebook was built for community, not distribution."
– Valeria Sillani, Global Social Media Manager, EasyVista
These numbers set the stage for understanding how different industries and content types perform on the platform.
Industry-Specific Performance
Engagement rates on Facebook vary significantly across industries. For example:
Education pages lead with an average engagement rate of 2.20% per post.
Healthcare and pharma pages follow closely at 1.90%.
Financial services and nonprofit pages hover around 1.80%.
Tech and SaaS companies see lower rates, averaging 0.90%.
Retail and consumer goods manage approximately 1.00%.
Sports teams, when measured by follower count, record a median engagement rate of 0.23%.
Content Types Driving Engagement
The type of content you post on Facebook can make or break engagement. Here’s how different formats stack up:
Simple status updates see engagement rates of around 0.20%, showing that conversational posts resonate well.
Facebook Reels perform strongly with a 1.83% engagement rate, 22% higher than standard video content. Short-form videos (15–30 seconds) are particularly effective, driving a 45% increase in completion rates.
Photos remain a favorite, achieving engagement rates of about 5.20%.
Link posts, on the other hand, lag behind with rates between 0.05% and 0.10%, likely due to Facebook's algorithm deprioritizing content that directs users off-site.
"On Facebook today, the content that wins isn't the most produced - it's the most participatory. Simple status posts outperform video because they meet users in a lean-back mindset, ask for almost no effort, and invite immediate interaction."
– Heather Brinckerhoff, Vice President Social Media and Digital Content, Great American Media
3. TikTok
TikTok continues to dominate social media engagement in 2026, even as the platform matures. As search behaviors shift, brands are also prioritizing answer engine optimization to maintain visibility across AI-driven platforms. The median engagement rate has dipped to 4.25% from 5.10% in 2024. Despite this decline, TikTok still delivers about 2.3× more engagement than Instagram, regardless of follower count. Its algorithm-driven "For You" page plays a key role, pushing content to non-followers and allowing even smaller accounts to reach massive audiences. Let’s take a closer look at TikTok’s engagement metrics, industry trends, and the types of content that perform best.
Engagement Rate Benchmarks
TikTok calculates engagement rates by dividing the total likes, comments, and shares by the follower count. In 2026, the average post on TikTok garners 3,492 likes, 50 comments, 248 shares, and 6,496 views. Nano-influencers (1,000–10,000 followers) lead the pack with a median engagement rate of 7.84%, while mega-influencers (500K+ followers) average just 1.84%. This represents a 4.3× drop in engagement from nano to mega accounts, a slightly sharper decline than Instagram's 4.2× gap.
User interaction patterns are also evolving. Comments per post have dropped by 24%, while shares have jumped 45% year-over-year. This suggests a shift toward more passive engagement, with users favoring private sharing over public discussions.
"TikTok shortens the distance between users and the content they actually care about, while Instagram is still catching up when it comes to frictionless discovery."
– Morgane Wasilewski, Social Media Manager, Channable
Industry-Specific Performance
Engagement rates on TikTok vary widely by industry, reflecting the platform’s diverse content ecosystem. Entertainment and comedy content lead with a median engagement rate of 6.92%, followed by educational and how-to videos at 5.78%. Higher education content performs exceptionally well, with some engagement rates reaching 7.36%. On the other hand, fashion and style average 3.21%, while beauty and cosmetics posts see a median of 3.48%. Lower-performing niches like these often grapple with inflated benchmarks due to fake followers, which can skew the data if not properly accounted for.
Motivational and self-improvement content stands out with an average engagement rate of 10.02%, while food and cooking-related posts maintain a solid 4.83%. Consistency also matters - brands posting four or more times a week see engagement rates 1.6× higher than those posting just once weekly.
Content Types Driving Engagement
Short-form videos remain TikTok’s bread and butter. Clips between 15 and 30 seconds achieve an engagement rate of 5.8%, while videos longer than 90 seconds drop to 3.2%. Interactive content works best. For example, entertainment videos are highly shareable, and educational clips often spark conversations in the comments as users seek more information.
"A 19-year-old filming a dorm room tour on their iPhone is generating more engagement than every corporate social media team with a six-figure content budget."
– Tim Eisenhauer, Apaya
Brands have adapted by increasing their posting frequency by 40% on average and shifting to more relatable, human-centered content. Videos featuring creators, team members, or founders resonate more than polished corporate messaging. This emphasis on shareability - encouraging viewers to forward content to friends - continues to drive engagement.
4. LinkedIn
LinkedIn continues to grow rapidly as a platform for engagement, with a 12.6% year-over-year increase in 2026. The median engagement rate has risen to 2.1%, up from 1.8% in 2025. While LinkedIn's engagement rates may not rival TikTok’s, its strength lies in building B2B authority and fostering professional connections. Personal profiles consistently outperform company pages, achieving engagement rates between 2.0% and 6.0%, compared to company pages, which typically hover below 0.50%. This difference underscores the importance of personal branding on the platform.
Engagement Rate Benchmarks
LinkedIn stands apart from platforms like Instagram or TikTok by focusing on professional networking and thought leadership. Nano-influencers with fewer than 5,000 followers achieve the highest engagement rates at 5.62%, while mega-influencers with over 200,000 followers average just 1.12%. Posting content that achieves a 6% engagement rate or higher places users in the top 5% of creators on the platform.
The platform’s algorithm favors long-form posts - between 800 and 1,600 characters - that encourage users to stay engaged on LinkedIn. Native content significantly outshines external links in performance. For instance, LinkedIn-native videos generate 312% more engagement than posts containing YouTube links. Document carousels, such as PDFs, lead the pack with engagement rates between 5.85% and 7.00%, which is 596% higher than text-only posts. Multi-image posts follow closely with 6.45% engagement, while video posts average between 4.7% and 6.0%.
Industry-Specific Performance
Different industries see varying levels of success on LinkedIn. Retail and consumer goods top the charts with a median engagement rate of 3.9%, while education follows with rates ranging from 3.0% to 4.0%. SaaS and technology companies average between 1.8% and 3.2%, but top performers in this space can reach engagement rates as high as 8.1%. Finance and fintech trail behind with median rates between 1.2% and 2.6%, yet content focused on company culture or team stories performs 89% better than traditional finance messaging. Marketing agencies average 2.4%, with top performers achieving rates as high as 9.2%.
"73% of B2B marketers are posting content on LinkedIn without knowing if their engagement rates are any good."
– Baz Furby, Founder, Grow with Ghost
These benchmarks emphasize LinkedIn's distinctive role in professional engagement and set the stage for effective content strategies.
Content Types Driving Engagement
Consistency is key on LinkedIn. Posting 3–4 times per week is ideal, and the first line of your post - truncated at about 210 characters - should grab attention with a provocative statement or question. Engaging promptly with comments can also boost visibility; responding within 60 minutes can triple a post’s reach by signaling value to LinkedIn’s algorithm.
When sharing links, avoid placing them directly in the post, as this can suppress visibility. Instead, add links in the comments or use document uploads to share resources. Maintaining a consistent post format for at least 30 days can further enhance engagement, with creators seeing a 43% boost compared to those who frequently change their approach.
5. X (formerly Twitter)
Let’s take a closer look at how X stacks up against other major platforms in terms of engagement. While X has shown some improvement - rising from a median engagement rate of 0.015% in 2024 to 0.12% in early 2026 - it still lags behind its past performance by 20%. Below, we’ll explore benchmarks, industry trends, and strategies to maximize engagement on the platform.
Engagement Rate Benchmarks
Engagement rates on X can vary widely depending on how they’re calculated. Studies report figures ranging from 0.02% to 0.12% (median by follower count) and 1.6% to 2.4% (average per post). Based on the SociaVault 2026 study, the overall median engagement rate is 1.11%.
Interestingly, smaller accounts tend to perform better. Nano-influencers (1,000–10,000 followers) average an impressive 2.18%, while mega-accounts (500K+ followers) drop to just 0.35%. As a general rule, engagement rates above 0.15% to 0.20% are considered respectable. Content type also matters - multi-tweet threads see 2.1× higher engagement than single tweets, and posts with native images perform twice as well as text-only ones.
Industry-Specific Performance
When it comes to industry-specific performance, there’s a noticeable divide between text-heavy sectors and those that rely on visuals. Politics leads the pack with a median engagement rate of 1.84%, while education and construction both hit an impressive 2.40% per post. Technology and SaaS companies follow closely at 2.20%, with nonprofits achieving a solid 2.10%.
On the flip side, industries like fashion, food & beverage, and health & beauty have largely moved away from the platform. Some studies show their engagement rates rounding down to 0.00%, with posting activity nearly disappearing. Media, entertainment, and retail also struggle, hovering around 1.70%. Overall, X is better suited for real-time updates, industry-specific news, and customer interactions rather than visual storytelling or broad brand campaigns.
Content Types Driving Engagement
Certain types of content consistently perform better on X. Threads, for instance, generate engagement rates between 0.18% and 0.25%, outperforming single tweets, which average 0.12%. The platform’s algorithm currently favors long-form content, especially thought leadership pieces, and rewards posts that gain traction within the first 30 to 60 minutes. Posts with bold opinions or "hot takes" tend to spark more replies, which the algorithm interprets as a positive signal. To maximize reach, avoid including links in posts, as they can negatively impact visibility.
Platform Comparison: Strengths and Weaknesses
This breakdown dives into how each platform stands out and where it struggles. Each platform has its strengths, catering to specific audiences and goals, but also faces limitations that may impact a brand's strategy.
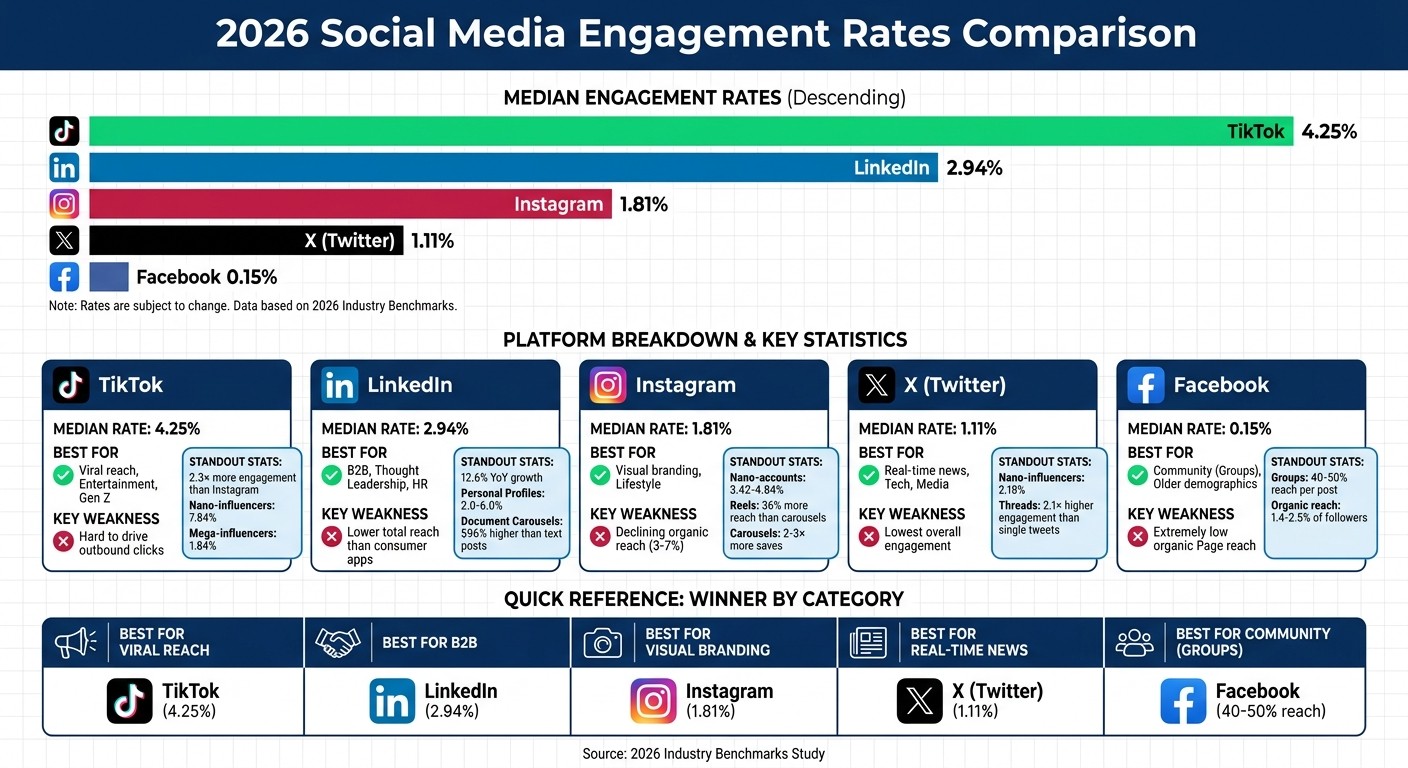
TikTok is a standout performer with a median engagement rate of 4.25%, delivering 2.3× more engagement than Instagram across all follower tiers. Its algorithm prioritizes watch time, which helps content go viral regardless of follower count. This approach maximizes exposure but makes driving external traffic a challenge, limiting its effectiveness for direct conversions.
LinkedIn has seen its engagement rates grow by 12.6% year-over-year, with a median engagement rate of 2.94%. It's a top choice for B2B industries, professional networking, and thought leadership. Document carousels are particularly effective, generating 3× to 5× more views than standard text posts. However, LinkedIn's overall reach is smaller compared to platforms aimed at broader consumer audiences, which can be a drawback for brands seeking mass appeal.
Instagram holds a median engagement rate of 1.81%. While Reels offer 36% more reach than carousels, carousels still drive 12% more interactions per impression. The platform excels in visual storytelling and lifestyle branding, but its organic reach has dropped to just 3–7%, pushing brands toward paid promotions to maintain visibility.
Facebook has become heavily reliant on paid advertising due to its organic Page reach plummeting to just 1.4%, with engagement rates around 0.15%. However, Facebook Groups remain a bright spot, delivering 30–50% higher interaction than Page posts. Additionally, the platform boasts a strong advertising conversion rate of 9.21%, making it a solid choice for paid campaigns despite its organic challenges.
X (formerly Twitter) struggles with a median engagement rate of 1.11%. Multi-tweet threads can boost interaction by 2× to 3×, and posts with native images double the engagement of text-only posts. However, some industries, like fashion and beauty, see engagement rates as low as 0.00% on the platform, highlighting its limitations for certain sectors.
This comparison provides a clear picture of how brands can align their efforts with the strengths of each platform while being mindful of their weaknesses.
Summary Comparison:
Conclusion
Engagement rates can differ significantly depending on the platform, follower count, and industry. For instance, TikTok stands out with a median engagement rate of 4.25%, while Facebook engagement rates can drop as low as 0.15%. LinkedIn, on the other hand, is on the rise, showing a 12.6% year-over-year growth. Meanwhile, X (formerly Twitter) is facing a decline, with engagement rates falling between 9.0% and 20%. These figures provide a clear picture of where your energy and budget might be best spent.
When evaluating your performance, focus on your specific tier and niche instead of comparing across all accounts. For example, a 2% engagement rate might underperform for an account with 5,000 followers but could be outstanding for one with 500,000 followers. If your numbers trail behind your industry median, aim to reach that benchmark within three months before setting higher goals.
"Industry averages are a starting point. Your most important benchmark is your own historical performance." - SocialRails
Today's algorithms prioritize actions like saves, shares, and watch time over likes and comments. To take advantage of this, create content that people want to save - checklists, how-to guides, and reference materials are great examples. Additionally, responding to comments within the first 30 minutes of posting can boost your content's distribution by 20–40%. These strategies can help you refine and strengthen your overall approach.
Finally, match your metrics to your goals. For brand awareness, monitor reach and impressions. For driving traffic, focus on click-through rates. And for community building, keep an eye on engagement rates and shares. Each platform serves a different purpose, so choose the one that aligns with your objectives.
FAQs
How should I calculate engagement rate for each platform?
Figuring out engagement rate is pretty straightforward. Here's how you do it:
Start by counting all interactions: Add up likes, comments, shares, and any other relevant engagement metrics.
Decide on the audience metric: Depending on your goals and the platform you're analyzing, you'll use either your follower count or your reach.
Use this formula:
Engagement Rate = (Total Interactions ÷ Followers or Reach) × 100%
The choice between using followers or reach as the denominator depends on what you're trying to measure and the platform's best practices.
What’s a “good” engagement rate for my follower size?
Engagement rates vary depending on the platform and the size of your audience. Smaller accounts often achieve higher rates, typically falling between 0.3% and 6%. For instance:
On Instagram, an engagement rate above 1% is considered solid.
LinkedIn tends to average between 2-5%.
TikTok often surpasses 4%, reflecting its highly interactive user base.
These benchmarks can serve as a useful reference to assess your performance and pinpoint opportunities to improve.
Which content types boost saves, shares, and watch time?
Content formats such as Reels, carousels, and Stories work wonders for boosting saves, shares, and watch time. Take Instagram Reels, for instance - they often generate impressive engagement rates. Meanwhile, Stories are great for sparking replies, which naturally increase interaction. What makes these formats so effective? Their visually engaging and interactive nature grabs attention and encourages users to save, share, or spend extra time exploring the content.
Related Blog Posts

uncategory
Apr 21, 2026
align-brand-voice-with-audience


